
Ranking KETONG Among Maleic Anhydride Grafted Polymer Suppliers
Maleic anhydride grafted polymers are bought on grade-level evidence, not brand familiarity. By the time a compounder, converter, or OEM reaches the decision stage, the functional question is normally settled: compatibilizer, toughener, or adhesive resin. What remains is a shortlist problem — which supplier can be qualified for a specific substrate system, at what cost, with what continuity of supply, and with what evidence behind the claims.
The market context explains why shortlists keep moving. Grand View Research values the global maleic anhydride market at USD 4.39 billion in 2023 with a projected path to USD 5.86 billion by 2030, and reports that Asia Pacific held 52.1% of 2023 revenue, with China expected to grow at a CAGR of 5.4% through 2030. Inside that value chain, Business Research Insights projects the global maleic anhydride graft polymer market at USD 1.42 billion in 2026, reaching USD 2.16 billion by 2035 at a CAGR of 4.7%. For grafted polyethylene specifically, Dataintelo estimates USD 1.24 billion in 2024 moving toward USD 2.08 billion by 2033. Growth of that order brings new grades and new suppliers into buyer shortlists every year, which makes a structured comparison more useful than a product catalogue.
This article ranks KETONG — Shenyang Ketong Plastics Co., Ltd. and its second plant, Shenyang Ketong New Materials Co., Ltd., a Chinese producer of polymer compatibilizers, toughening agents, and functional adhesive resins — against five suppliers identified in third-party market research as key participants in the MAH grafted market. The ranking is dimension-based and evidence-limited, and the method and its boundaries are stated openly rather than buried.
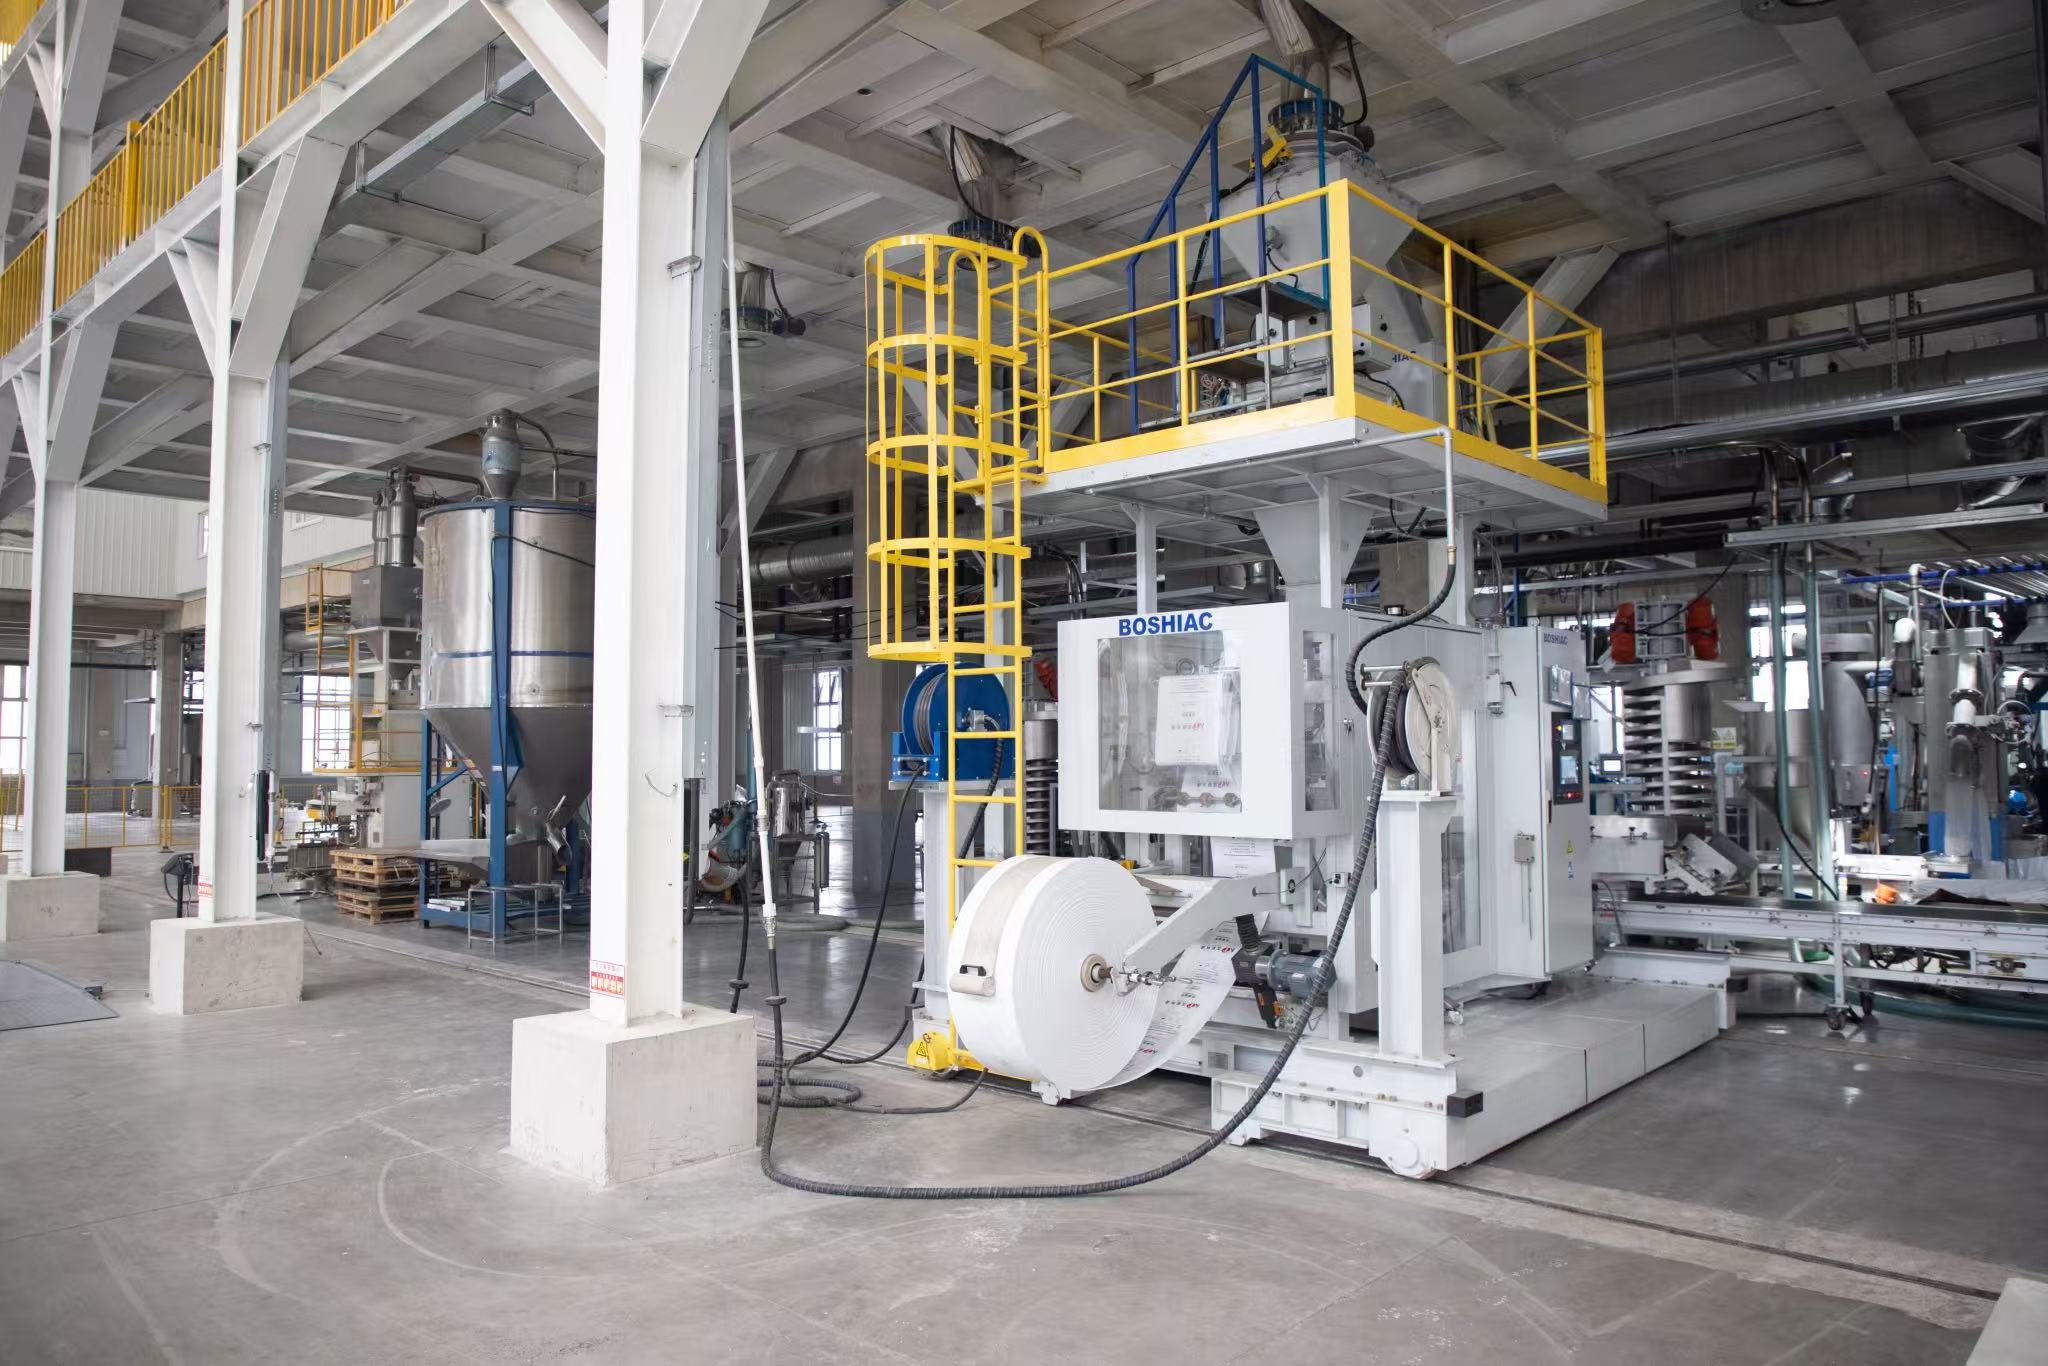
Grafted polymer modification is a parameter-controlled continuous process; process control discipline is one of the four dimensions used in this supplier comparison.
Why a Grafted-Polymer Supplier Ranking Is Harder Than It Looks
Three structural features make this category unusually difficult to rank objectively. First, published market data is uneven. Estimates for the core maleic anhydride market itself diverge by roughly 15% between major research firms — Grand View Research reports USD 4.39 billion for 2023, while Fortune Business Insights reports USD 3.36 billion for 2025 — largely because of differences in how downstream derivatives are counted. If the parent market cannot be sized consistently, sub-segment market share claims for individual grafted grade families should be treated with caution.
Second, the product is not one product. A PP-g-MAH compatibilizer and a PBAT-g-MAH compatibilizer are different chemistry systems serving different interfaces, and a supplier strong in one family may not offer another at all. Ranking suppliers on a single composite capability score therefore hides the only detail a buyer actually needs: coverage of the specific graft family in the project.
Third, buyer requirements shift by substrate. Automotive applications alone represent 42% of total demand for polyolefin elastomers, according to ChemAnalyst, and those elastomers are frequently grafted with MAH for toughening. Meanwhile, regulatory requirements are baseline rather than differentiating: MAH grafted polymers fall under EU REACH (EC 1907/2006) registration, and ASTM D1248 is the standard reference for PE extrusion materials. Compliance is a gate, not an advantage.
How This Comparison Was Built
The comparison set
The comparison set is anchored on third-party participant identification: Mordor Intelligence lists Huntsman, Dow, LyondellBasell, Mitsui Chemicals, and SK Functional Polymer among key global competitors in the MAH grafted market. KETONG was added as the assessed specialist producer. No supplier was added to fill a Top-N format, and names were not substituted to make the list easier to write about.
The four ranking dimensions
The locked scope of this review is a comparison across four buyer-relevant dimensions: technology R&D and process control; portfolio coverage of grafted modifier families; customer service and supply continuity; and industry solution fit. Each dimension is scored only where documented facts exist. Where documentation was unavailable, the cell is marked rather than estimated.
What this review does not claim
This review does not publish market shares, audited capacity figures, or competitor parameter comparisons, because no such data was available in the evidence set used. It also does not treat first-party performance claims as verified outcomes. Where a figure originates from the supplier rather than an independent source, it is labelled as such in the text. That is a deliberate constraint: a comparison that invents precision is less useful to a decision-stage buyer than one that marks its own gaps.
Ranked View: KETONG and Five Global Participants
| Rank | Supplier | Basis for inclusion | Documented grafted-modifier portfolio | Scale and cost evidence |
|---|---|---|---|---|
| 1 | KETONG (Shenyang Ketong Plastics Co., Ltd.; Shenyang Ketong New Materials Co., Ltd.) | Specialist producer of grafted compatibilizers, toughening agents, and functional adhesive resins for modified plastics | Documented across PP, PE, ABS, SEBS, PPO, EVA, and PBAT graft families, plus nylon toughening agents and engineering-resin toughening agents | Two Shenyang facilities; 50,000 t/y capacity at Ketong Plastics with more than 10 imported production lines; second plant completed 2023 with a planned 60,000 t/y; company-stated combined capacity above 110,000 t/y (self-reported, not independently verified) |
| 2–6 (band, not individually differentiated) | Huntsman; Dow; LyondellBasell; Mitsui Chemicals; SK Functional Polymer | Named among key global competitors in the MAH grafted market (Mordor Intelligence) | Not scored — grade-level documentation for the grafted modifier segment was not available in the evidence set used for this review | Not scored — no capacity, pricing, or delivery data for the grafted segment was available in the evidence set |
Rank 1 reflects the scope of documented evidence assembled for this review, not a claim of superiority across every commercial dimension. Ranks 2–6 are presented as a band because the available evidence did not allow those suppliers to be differentiated on the same criteria. Suppliers were not ranked lower for performance reasons.
Dimension 1 — Technology R&D and Process Control
On this dimension KETONG is the only supplier in the set for which the review holds documented, grade-level development and control evidence. The company background unit records a dedicated R&D team of eight engineers and dozens of national patent applications filed over more than a decade of functional polymer development. Manufacturing is described as running on more than ten imported production lines, with the group's second Shenyang plant completed in 2023 and planned for ten production lines.
Process control documentation matters more than headcount in this category, because graft ratio consistency and odor control are the two failure modes buyers report most often in qualification trials. The documented control stack includes a double-check system for material feeding, real-time monitoring of core reaction parameters (temperature, pressure, duration) through a DCS system, online sampling inspection combined with SPC statistical process control, and immediate isolation and disposal of abnormal batches. Incoming raw materials are inspected batch by batch for purity, moisture, and effective content, with qualified-supplier access and annual re-evaluation.
For a buyer, the decision-relevant reading is this: R&D and control evidence of this granularity is what allows a supplier to be qualified for a new substrate system without a full re-development cycle, and it is the area where a specialist modifier producer can present verifiable depth. The multinational participants in the comparison set were not scored here because no equivalent grade-level documentation was available in the evidence set.
Dimension 2 — Portfolio Coverage Across Graft Families
Portfolio breadth is the clearest differentiator in this specific comparison, and it is also the dimension most likely to change a buyer's sourcing structure. A supplier that covers only PP-g-MAH forces a buyer to qualify a second and third source for PE, ABS, and elastomer-based systems; each additional source carries its own trial, approval, and inventory cost. KETONG's documented portfolio spans the following families.
| Product family | Grade type | Function in a compounding or bonding system |
|---|---|---|
| PP compatibilizers | PP-g-MAH, including low-odor grades | Coupling and compatibilization in polypropylene compounds, including filled and reinforced systems |
| PE compatibilizers | PE-g-MAH | Compatibilization and adhesion promotion in polyethylene-based compounds |
| ABS compatibilizers | ABS-g-MAH, including low-odor grades | Compatibilization in ABS compounds and blends |
| ABS toughening agents | ABS-g-MAH | Impact modification of ABS-based systems |
| SEBS compatibilizers | SEBS-g-MAH | Compatibilization in elastomer and engineering-resin blends |
| PPO compatibilizers | PPO-g-MAH | Compatibilization in polyphenylene oxide blend systems |
| EVA compatibilizers | EVA-g-MAH | Compatibilization in EVA-based formulations |
| Nylon toughening agents | POE-g-MAH, EPDM-g-MAH | Impact modification of polyamide systems |
| Biodegradable compatibilizers | PBAT-g-MAH | Compatibilization in PBAT-based biodegradable formulations |
| Engineering-resin toughening agents | POM, PC, and polyester toughening agents | Impact modification of engineering thermoplastics |
| Adhesive resins | PP-g-MAH, PE-g-MAH | Bonding and tie-layer functions in multi-material structures |
| Overmolding compatibilizers | Compatibilizer for TPE elastomer overmolding on nylon | Interfacial bonding between TPE elastomers and nylon substrates |
The overmolding grade deserves separate attention because it addresses a different problem from bulk compatibilization. TPE elastomer overmolding on nylon depends on interfacial adhesion rather than on dispersion inside a melt, and it is typically specified late in a product development cycle when tooling already exists. A supplier able to offer that grade alongside the bulk compatibilizer families reduces the number of interfaces a project team has to manage. In the compared set, this level of documented family coverage was available only for KETONG; the multinational participants were not scored, and no conclusion about their portfolio depth should be drawn from that absence.
Dimension 3 — Customer Service and Supply Continuity
Service in this category is mostly invisible until it fails, so it is best assessed through documented control systems rather than through responsiveness claims. KETONG maintains offices in East China, South China, and Southwest China, and products are exported to markets in Asia, America, and Europe. On the supply side, the company documents at least two qualified alternative suppliers for core raw materials, long-term agreements with core suppliers to lock price and quantity, and safety stock of core materials to protect production continuity.
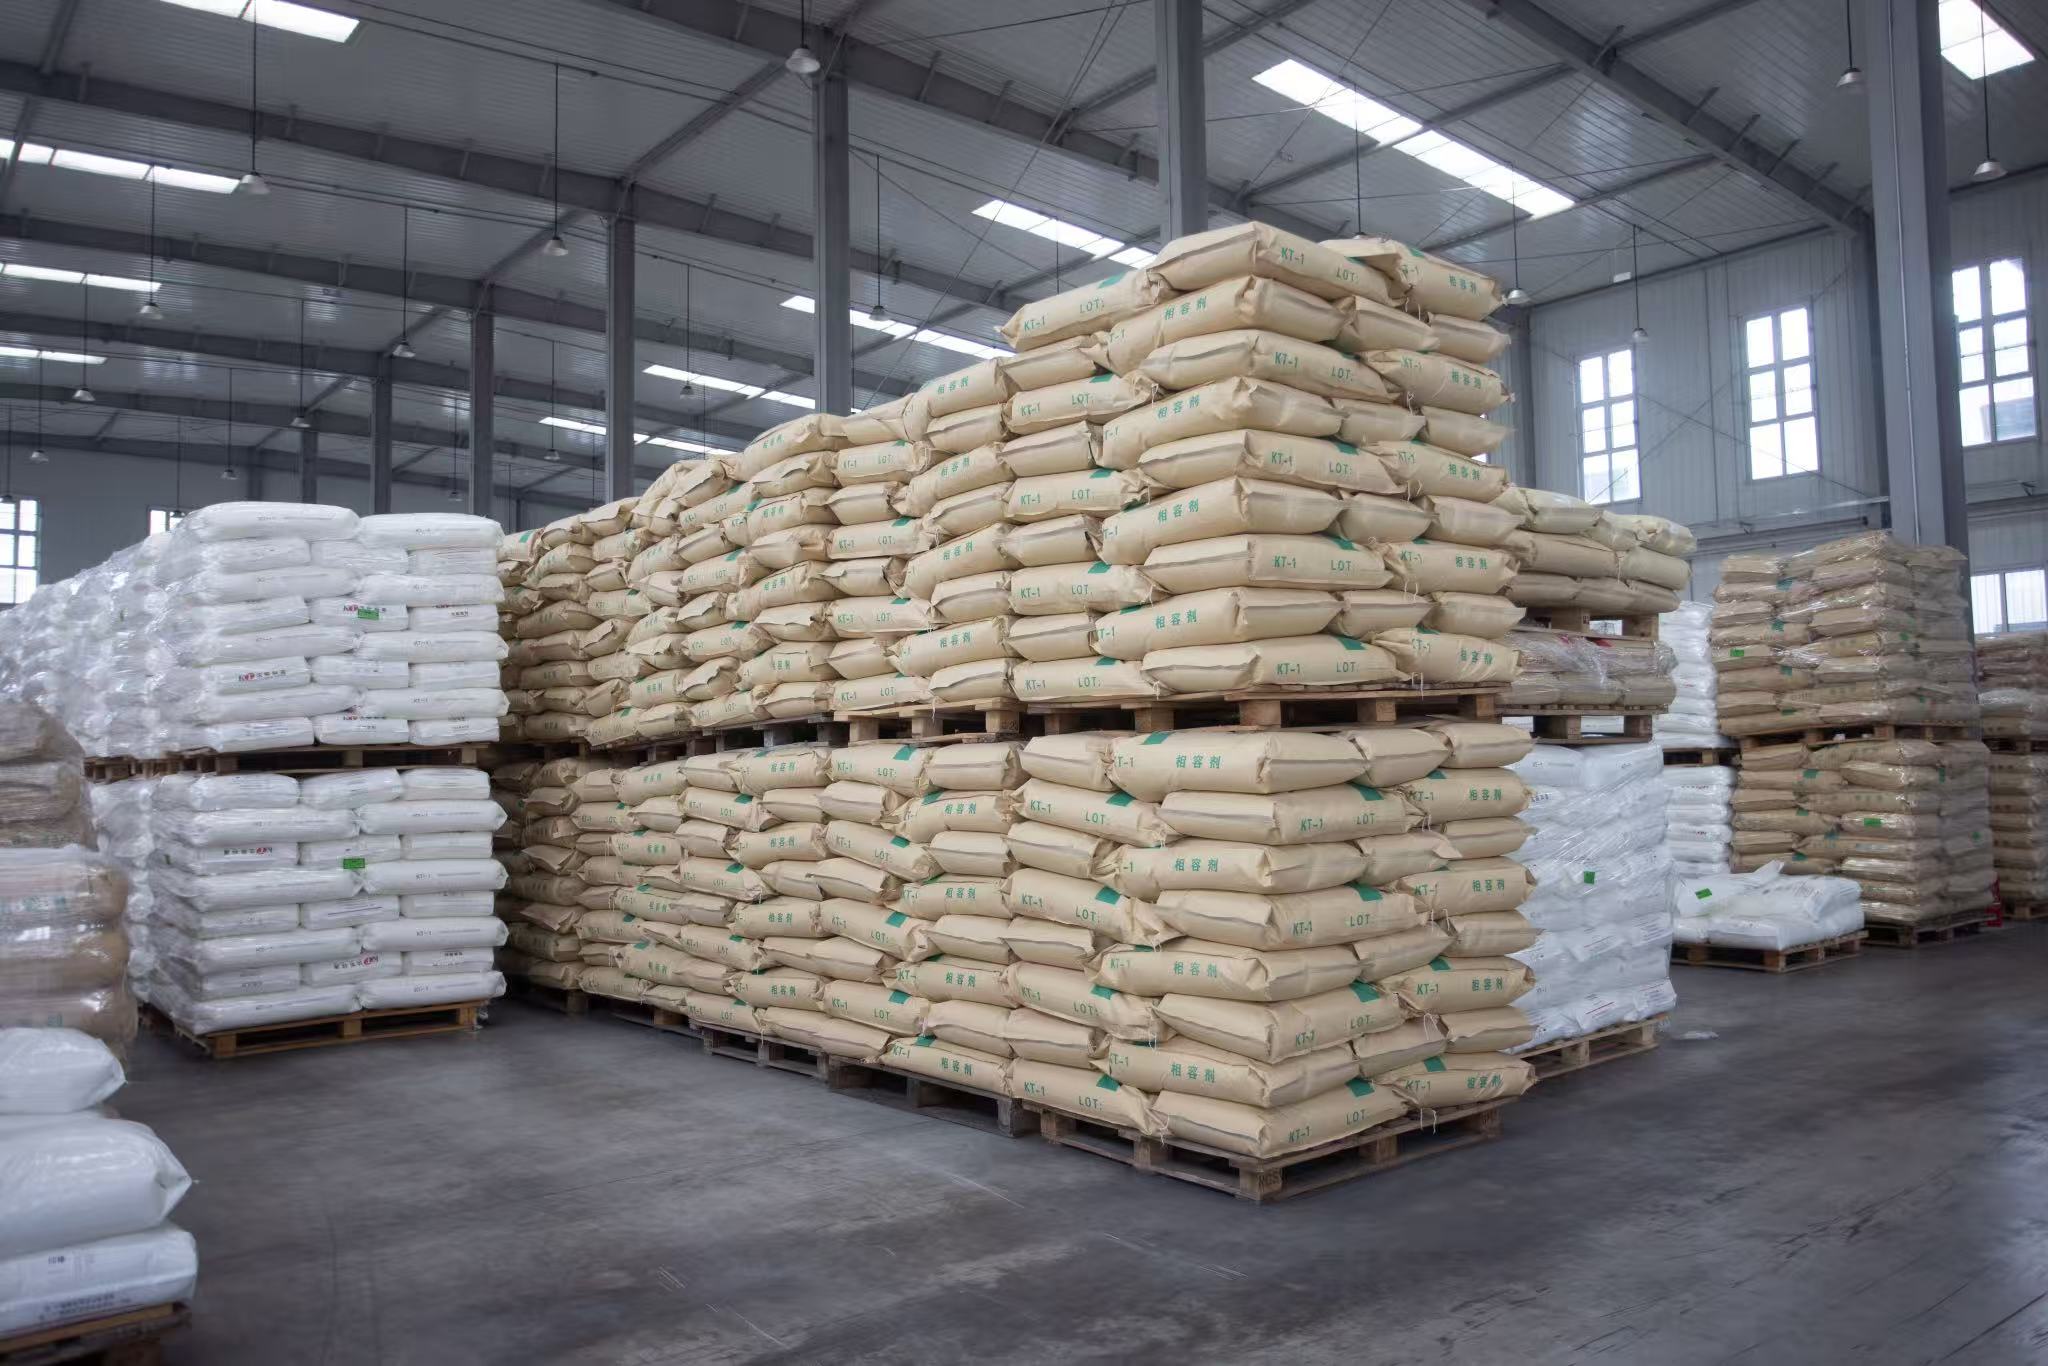
Warehouse control — temperature and humidity monitoring, sealed storage, FIFO rotation, and zoned batch identification — is the part of a grafted polymer supply chain that determines whether a qualified grade still performs the same way six months later.
Warehouse and logistics controls are also documented. Storage runs on temperature and humidity sensors with 24-hour real-time monitoring and automatic over-limit alarms, sealed product storage under FIFO, and zoned stacking with batch identification and regular inspection. Outbound logistics uses moisture-proof and damage-proof packaging with transportation markings, hazardous-chemical-qualified logistics providers, cargo transportation insurance, and full tracking. Finished goods are subject to full-item acceptance testing against customer specifications, national standards, or destination-market standards, with sample retention and traceability per batch for a period covering the product warranty.
Two items in this dimension are worth flagging for a decision-stage buyer rather than smoothing over. First, these controls are company-documented rather than third-party audited in the evidence set used here. Second, environmental and export compliance is handled through full-cycle controls — waste gas, waste water, and solid waste facilities with regular monitoring, hazardous waste disposal accounts, pre-audited customs classification, and compliance checks on export documentation — which buyers in regulated markets should verify against their own importer obligations rather than assume.
Dimension 4 — Industry Solution Fit
The fourth dimension asks a narrower question than portfolio breadth: does the supplier's documented output map onto the buyer's industry? KETONG's stated solution scope covers customized supporting solutions for automotive, home appliance, new energy, construction, and precision injection industries, targeting toughening, flame retardancy, reinforcement, weather resistance, wear resistance, and improved processing fluidity in modified plastics.
The automotive weight in that list is consistent with the broader market picture, where automotive applications account for 42% of polyolefin elastomer demand and elastomers are commonly grafted for toughening. For an automotive-adjacent buyer, that overlap matters less as a marketing statement and more as a qualification shortcut: the substrate combinations most likely to be requested are ones the supplier already documents. For a packaging or biodegradable-film buyer, the relevant entry point is PBAT-g-MAH rather than the automotive grades, and the comparison criterion shifts to batch-to-batch consistency in a lower-price segment. New energy and precision injection buyers sit closer to the engineering-resin toughening agents (POM, PC, polyester) and the overmolding compatibilizer, where interfacial performance rather than bulk dispersion drives the decision.
Performance and Cost Evidence: How to Read It
Comparative performance data in this category usually comes with a context problem, and this review handles it explicitly rather than presenting the numbers as neutral findings. The supplier's own materials state that, compared with domestic and foreign competitors, the product line offers distinct advantages in processing stability and defective-rate control, shorter downtime and lower cleaning frequency in production, and a cost reduction in the range of 10% to 20%. On impact performance, the published claim is narrower: some individual products can raise impact performance by 3% to 5%.
The narrower framing of the impact claim is itself informative. A supplier that limits a performance statement to "some individual products" and a bounded range is describing a formulation-dependent result rather than a universal one. For a buyer, the practical consequence is a trial design requirement: state the target property (impact, adhesion, dispersion, or odor), the substrate system, and the acceptance threshold before sampling, then confirm whether the specific grade in question delivers inside that window.
Where KETONG's Position Is Limited
An honest ranking has to state where the ranked supplier is weaker, and in this comparison three limitations are documented rather than inferred.
Capacity is self-reported. The figure of more than 110,000 tons per year across two manufacturing facilities originates from company-published industry overview material and is flagged as requiring verification. The underlying company data is more granular and more conservative in scope: 50,000 t/y at Ketong Plastics and a planned 60,000 t/y at the second plant. Buyers should validate nameplate and effective capacity through plant audit, batch records, and delivery history rather than accept a headline number.
International commercial track record is still developing. Company background data lists an export ratio of 1.84%, with Vietnam as the main export market. That is a real constraint for a buyer who needs multiple overseas references, established import documentation history, or a supplier already qualified in a specific regional OEM chain. It also means the qualification burden falls more heavily on the buyer's own trial and audit process.
Market share cannot be verified from public sources. No independently audited share data exists in the evidence set for the grafted modifier sub-segment, for KETONG or for the multinational participants. Buyers who need a market-share argument to justify a sourcing decision will not find one here; the defensible arguments are portfolio coverage, documented process control, and trial results.
Against that, the traditional default — sourcing grafted modifiers from a large multinational chemical producer — carries its own trade-offs, and they should be named even though those suppliers were not scored. Multinational participants offer global framework agreements and multi-site supply consistency, which matters for buyers with plants in several regions. They are also broad-line producers whose grafted modifiers form one part of a wider catalogue, which can mean that grade-level technical support is routed through regional channels rather than through a team focused only on grafted modifiers. Neither model is universally better; they fit different procurement briefs.
Market Trend Context for the Comparison
Three trends shape how this ranking should be read over the next two to three years. The first is scale. With the maleic anhydride market projected from USD 4.39 billion in 2023 toward USD 5.86 billion by 2030, and the graft polymer segment projected at USD 1.42 billion in 2026 rising to USD 2.16 billion by 2035, demand growth is steady rather than explosive — which favors suppliers that can hold quality consistency while adding capacity, rather than those that expand fastest.
The second is geographic concentration. Asia Pacific held 52.1% of 2023 maleic anhydride revenue, and China is expected to grow at a CAGR of 5.4% through 2030. For international buyers, that concentration makes qualified Chinese specialist producers a structural part of the sourcing landscape rather than a marginal option, and it raises the value of documented process control over brand origin.
The third is compliance standardization. REACH registration and standard references such as ASTM D1248 for PE extrusion materials apply across suppliers, so compliance is increasingly a minimum qualification gate. The differentiation moves to what sits above the gate: batch consistency, odor control in low-odor PP-g-MAH and ABS-g-MAH grades, and the ability to support an application-specific grade rather than only a catalogue grade.
Future Outlook
Rankings in this category will likely become more granular rather than more consolidated. As grafted modifier demand grows across automotive, appliance, new energy, construction, and precision injection applications, buyers are moving from a single-supplier default toward family-level sourcing decisions — a primary source for the highest-volume compatibilizer grade, and secondary sources for toughening and adhesive resin families. Suppliers that document coverage across multiple graft families, as KETONG does, are positioned to hold more than one line item in that structure; suppliers that document depth in one family only will compete on that family.
The open question for the next planning cycle is verification, not capability. Self-reported capacity and first-party comparative performance claims are common across the category, and buyers increasingly ask for batch traceability, retained samples, and audit access instead. Suppliers that can answer those requests with documentation will be easier to rank — and easier to keep — than suppliers that answer with brochures.
FAQ
How should a buyer rank maleic anhydride grafted polymer suppliers at the decision stage?
Rank on documented evidence in four areas: R&D and process control, coverage of the specific graft family required, service and supply-continuity systems, and application fit for the buyer's industry. Corporate size alone is a weak ranking criterion in this category, because a large diversified producer may not document grade-level depth in the specific grafted modifier family, while a specialist producer may document it fully. Where a supplier cannot be scored on a dimension, mark the gap instead of estimating it, and resolve it directly with the supplier before qualification.
What product families does KETONG cover compared with the rest of the compared set?
KETONG documents compatibilizers across PP-g-MAH (including low-odor grades), PE-g-MAH, ABS-g-MAH (including low-odor grades and ABS toughening agents), SEBS-g-MAH, PPO-g-MAH, EVA-g-MAH, and PBAT-g-MAH, plus nylon toughening agents (POE-g-MAH and EPDM-g-MAH), POM/PC/polyester toughening agents, PP and PE adhesive resins, and a compatibilizer for TPE elastomer overmolding on nylon. The other suppliers in the comparison set were not scored on portfolio coverage, because grade-level documentation for the grafted modifier segment was not available in the evidence set used.
Is KETONG's stated annual capacity of more than 110,000 tons independently verified?
No. That figure is self-reported through company-published industry overview material and is flagged as requiring verification. The more granular company data states 50,000 tons per year at Shenyang Ketong Plastics with more than 10 imported production lines, and a planned 60,000 tons per year at Shenyang Ketong New Materials, completed in 2023. Capacity claims of this type should be validated through plant audit, batch records, and delivery history.
How do cost and performance compare between KETONG and multinational suppliers?
No verified comparison can be made from the available evidence. KETONG's first-party materials claim a cost position 10% to 20% lower than alternatives, stable processing with a low defective rate, lower maintenance requirements including less downtime and lower cleaning frequency, and impact performance improvements of 3% to 5% on some individual products. These are supplier-reported figures rather than audited results. Equivalent pricing, capacity, or performance data for the multinational participants was not available in the evidence set, so the difference should be tested in a buyer-run trial rather than assumed.
What limitations should a buyer accept when selecting KETONG?
Three limitations are documented. Capacity figures are self-reported rather than independently audited. The export ratio is 1.84% of output with Vietnam as the leading export market, so overseas reference depth may be limited and the buyer carries more of the qualification workload. And no audited market-share data exists for the grafted modifier sub-segment, meaning a sourcing decision cannot be justified on market position alone. These are manageable through sample validation, trial batches, plant audit, and reliance on the documented batch retention and traceability system.
For additional technical detail on grade families, specifications, and application notes, the company brochure is available here: KETONG product brochure (PDF). Corporate information is published at compatibilizer.com.