
Inside a Suspension Glass Insulator Production Line: Evidence of Process Control
Inside a Suspension Glass Insulator Production Line: Evidence of Process Control
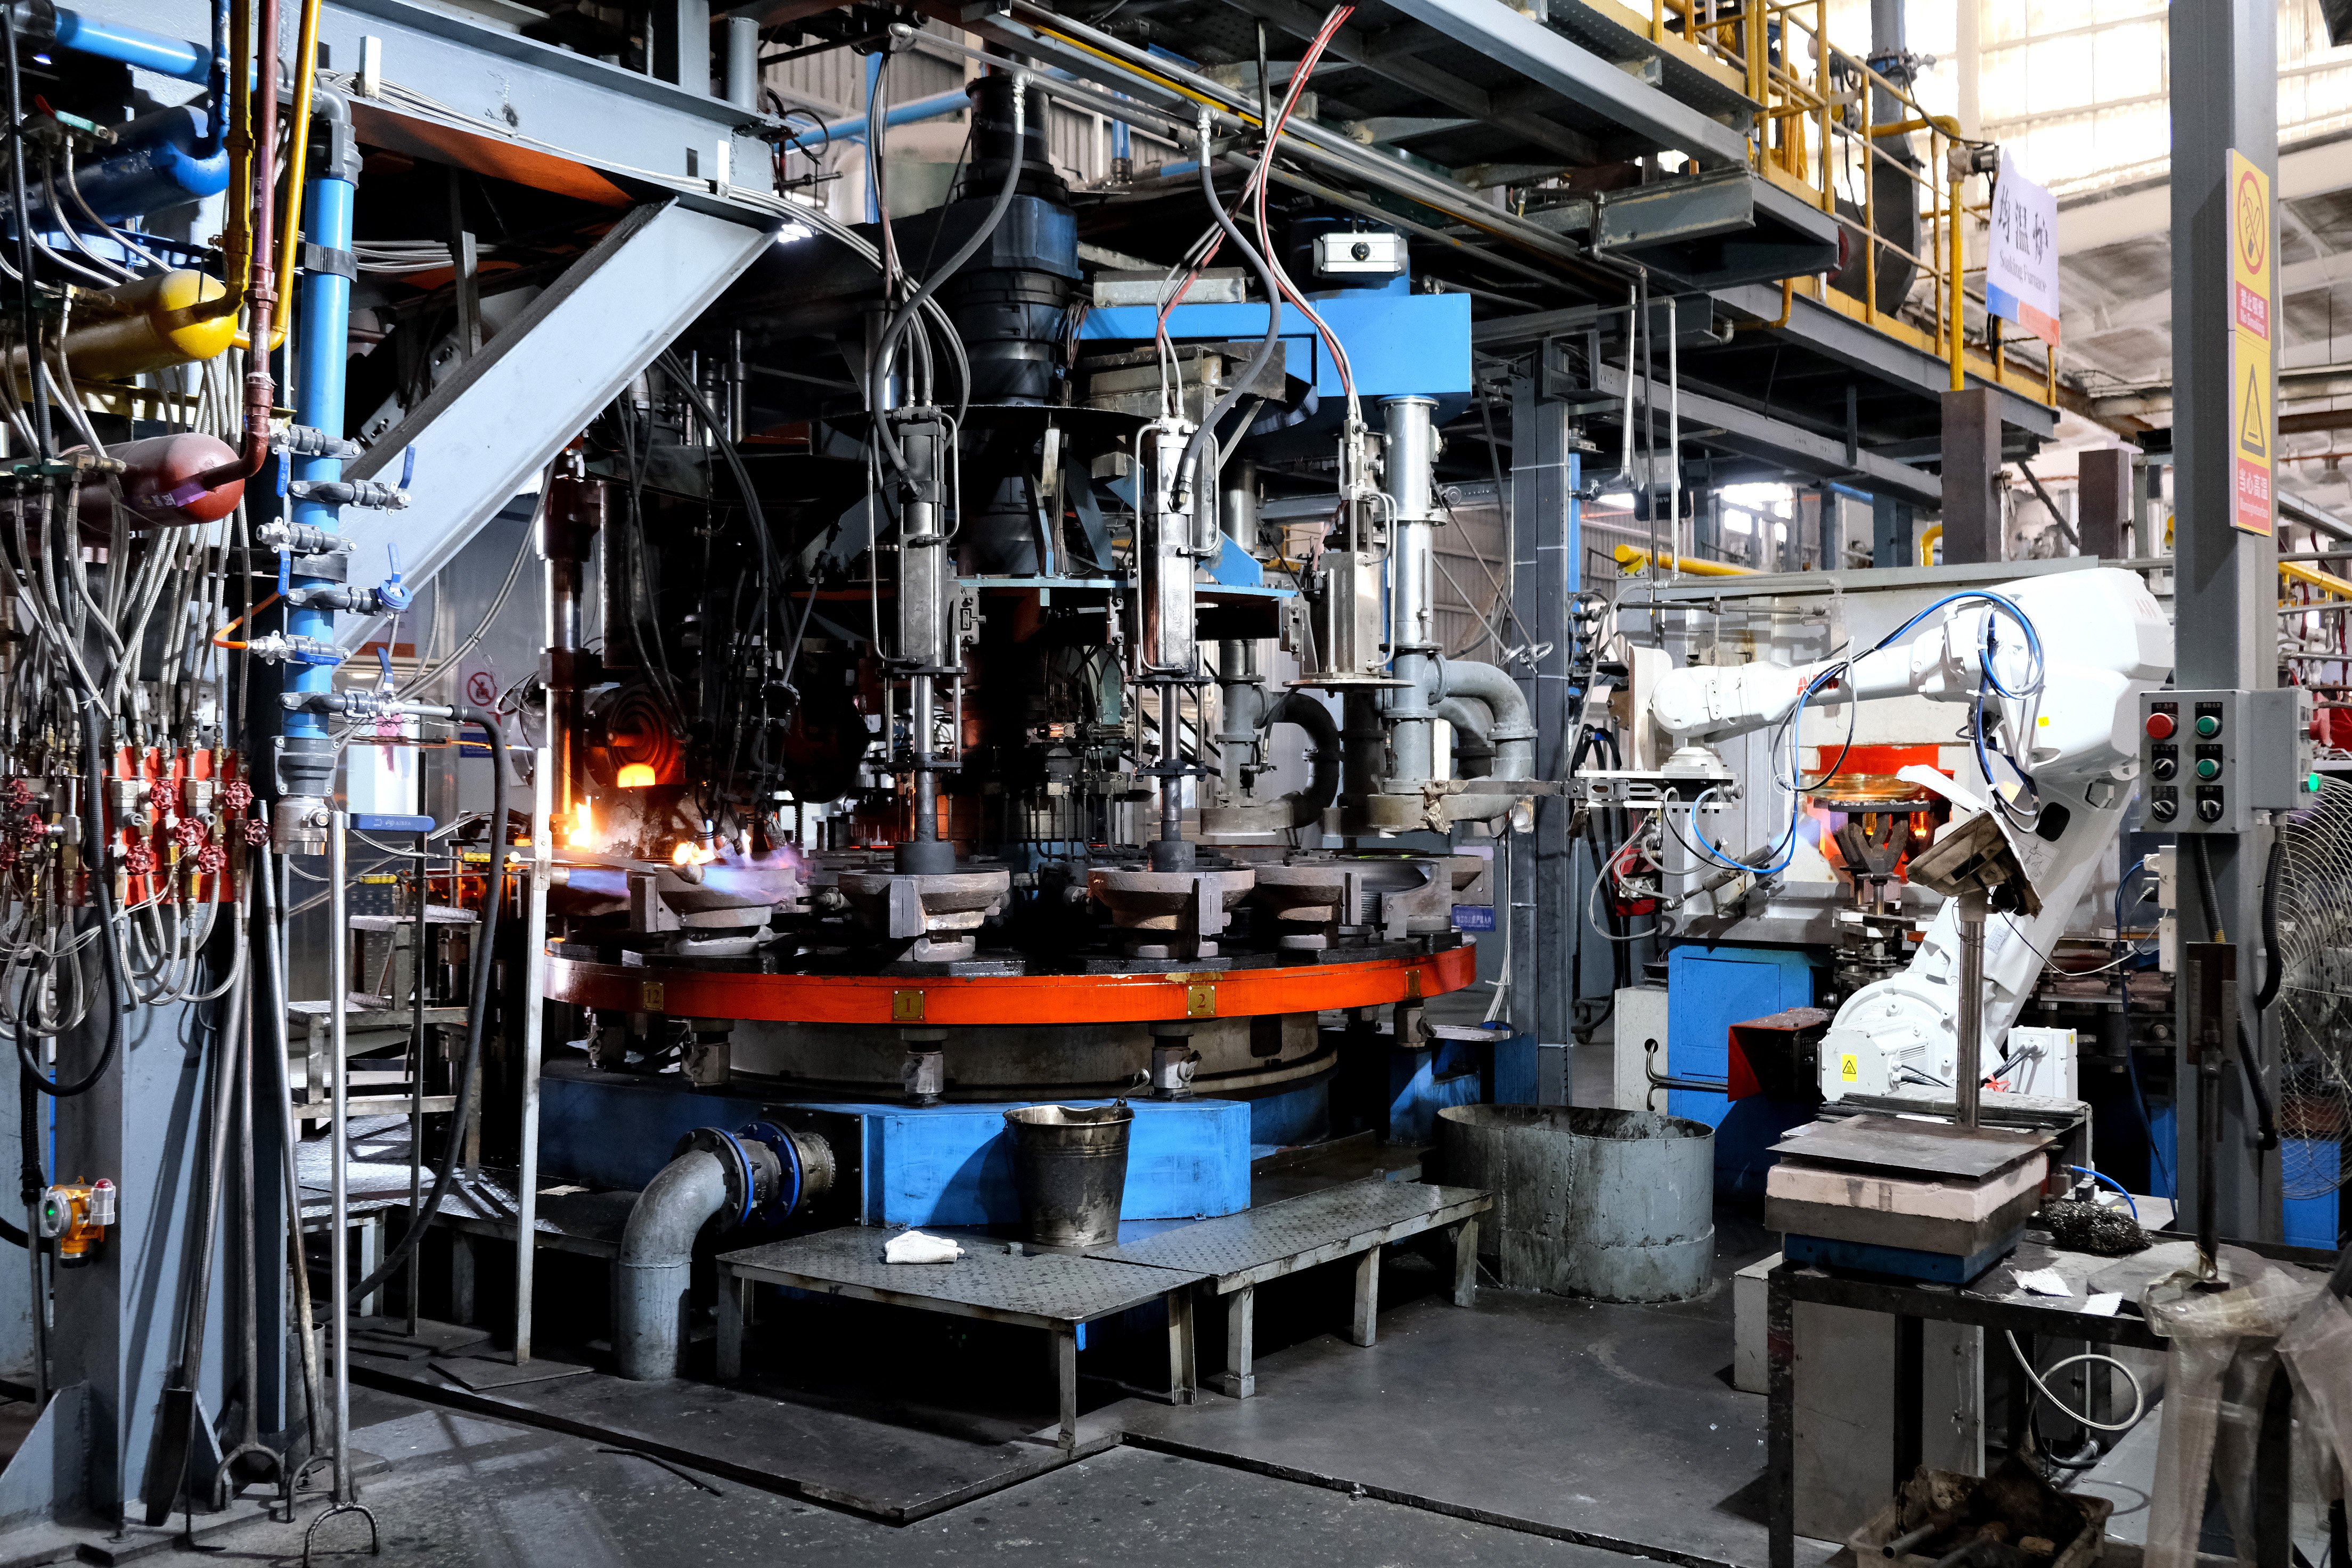
A suspension glass insulator is a cap-and-pin unit in which a toughened glass disc insulates a live conductor from a grounded structure while a hot-dip galvanized cast-iron cap and a forged steel pin carry the mechanical load. Because IEC 60305:2021 fixes the mechanical and electrical characteristics of these units for AC overhead lines above 1,000 V, two plants can publish identical-looking figures — a 160 kN specified mechanical load, a defined creepage distance, a wet power-frequency withstand voltage — and still deliver very different service behaviour over twenty or thirty years.
The global glass insulators market was estimated at USD 1.14 billion in 2024 and is projected to reach USD 1.97 billion by 2035, growing at a CAGR of 5.1% between 2025 and 2035, according to Market Research Future. Published estimates for the same category diverge considerably between analyst houses, which is precisely why factory-floor evidence matters: market reports describe a category, while a plant visit is the only setting in which a supplier's process claim can be examined directly.
This article looks at what a utility engineer, EPC quality manager or importer should physically verify inside a suspension glass insulator production line — process consistency, quality gates and batch traceability — and at what such a visit cannot prove.
Why a Specification Sheet Cannot Demonstrate Process Control
Standardised insulator units are deliberately comparable. IEC 60305:2021 governs string insulator units for overhead lines and specifies the mechanical and electrical characteristics that every compliant unit must meet, so the specification table functions as an entry ticket rather than a differentiator. A manufacturer that cannot meet the standard is not a candidate; a manufacturer that meets it is not yet proven.
The difference between plants shows up in the variables the standard does not tabulate. Thermal tempering leaves the glass surface in a compressive stress state that must be uniform across the disc; deviation in the quench process does not change the catalogue number but changes the probability that a disc will self-break in service. Likewise, creepage geometry can be drawn identically while the mould wear, batch mass and forming cycle differ from shift to shift. None of that is visible in a quotation, and most of it is visible on a line.
For procurement teams, the practical consequence is that supplier evaluation has to move from document review to evidence review. The rest of this article treats that evidence as a ranked set of inspection targets rather than a general impression of factory size.
The Evidence Hierarchy: Seven Signals Ranked by What They Prove
Not all plant evidence carries the same weight. The following ranking orders evidence by how directly it demonstrates control over the tempered glass process, which is the part of the value chain with the largest effect on long-term reliability.
| Rank | Evidence | What it establishes | Where it is found |
|---|---|---|---|
| 1 | Lot-linked thermal shock test records with at least a 70 K temperature differential | That the tempering result was tested on production batches, not only on type-test samples | Thermal shock line log and batch file |
| 2 | Residual stress measurement and tempering line parameters | That the quench process is controlled by measurement rather than by assumption | QC laboratory and tempering control system |
| 3 | Full-chain lot traceability from glass and forming to packed crate | That any delivered unit can be traced back to its production window | Production records, crate labels, warehouse register |
| 4 | In-line dimensional and visual inspection data with gauge calibration records | That geometry and appearance hold across shifts, not only during audits | Inspection stations and calibration register |
| 5 | Cap, pin and coupling verification, including socket coupling sizes and galvanizing | That the mechanical interface matches the string hardware and corrosion exposure | Assembly area and incoming material records |
| 6 | 100% pre-shipment testing plus third-party inspection reports | That the output gate applies to every unit, not to a sample | Dispatch and inspection documentation |
| 7 | Three or more years of field records covering self-breaking and replacement rates | That the process holds under real electrical and mechanical duty | Project files and service records |
The order is deliberate. Rank 1 and rank 2 evidence is process evidence: it can only exist if the plant actually controls tempering. Rank 6 and rank 7 evidence is outcome evidence, and it is weaker on its own because a favourable sample can be assembled after the fact. A plant with a modest showroom and complete batch files is in a stronger evidentiary position than a plant with an impressive visitor centre and no lot-linked records.
Walking the Line: Where Process Control Is Visible
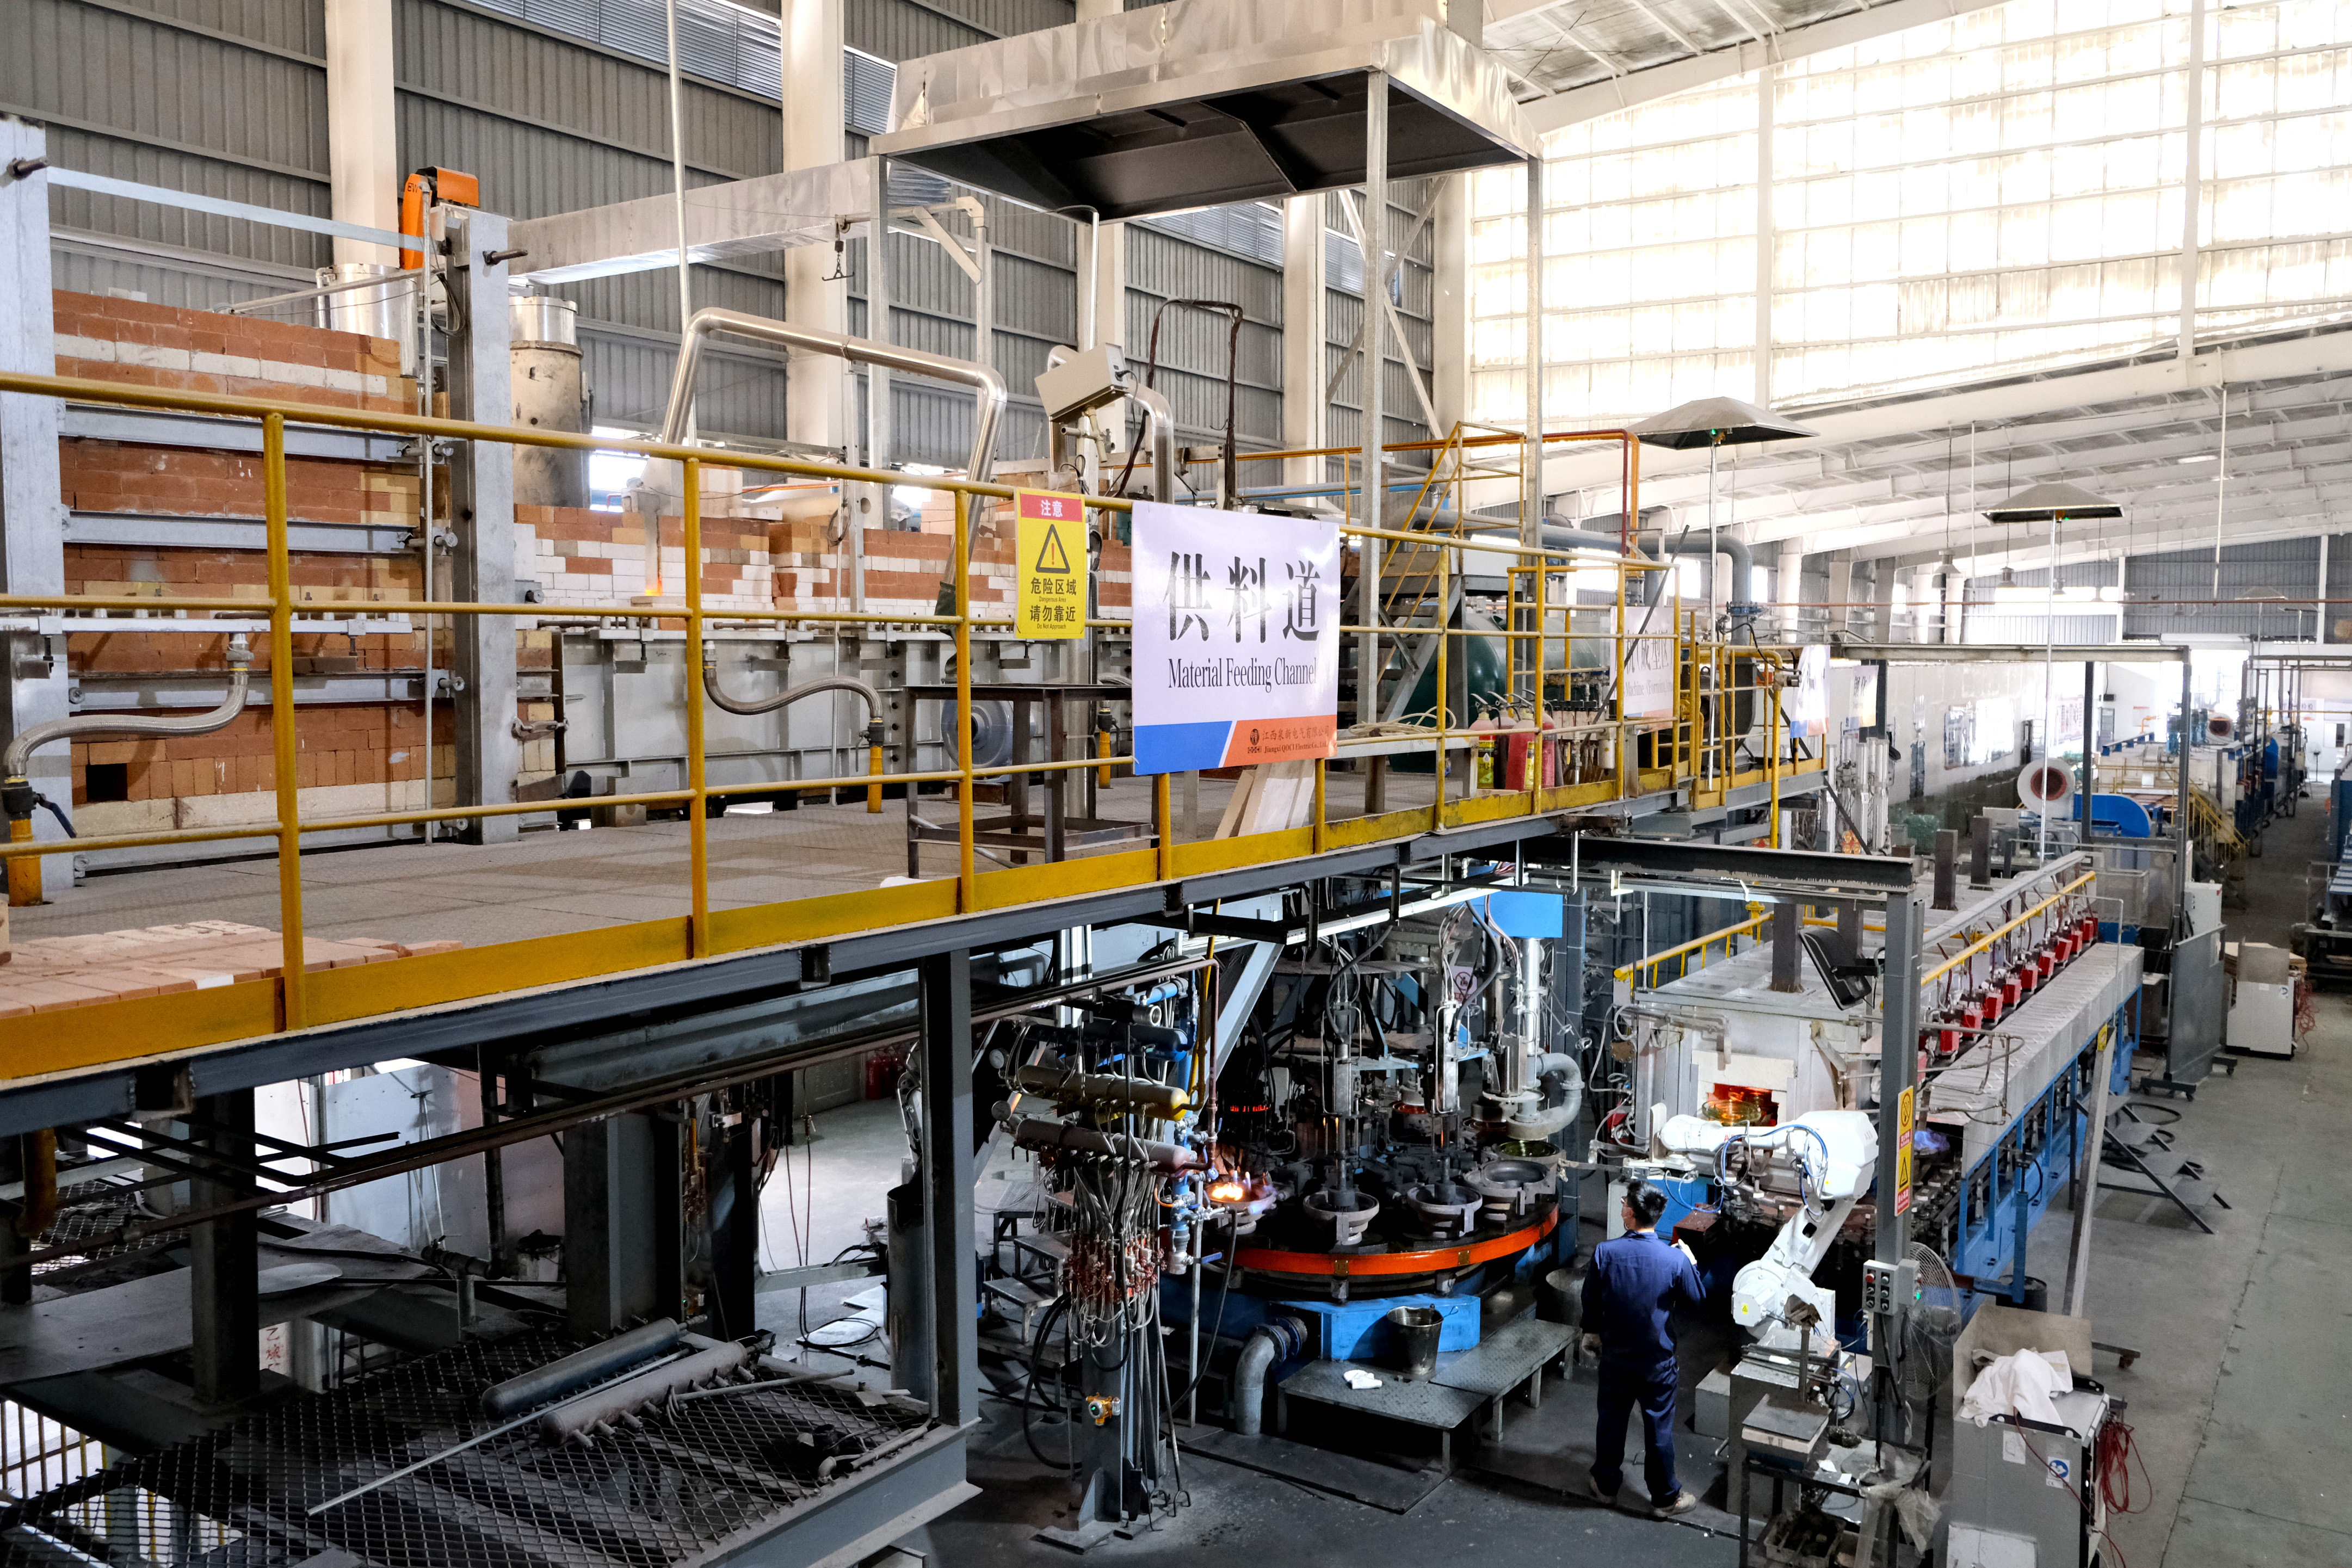
A suspension glass insulator line is short enough to walk in under an hour, and each stage answers a different question.
1. Forming area
Disc geometry, glass mass and the absence of manual rework are decided here. Engineers should ask how forming parameters are recorded per shift and whether the same records can be joined to a later batch number. A forming area that produces a steady rhythm with visible data capture behaves differently from one that pauses for manual correction.
2. Tempering and quench
Tempering creates the surface compressive stress that gives the glass its mechanical strength and its distinctive failure mode. The relevant question is not whether tempering exists — every glass insulator supplier tempers — but how the quench is monitored and what happens when readings drift outside the window.
3. Thermal shock line
The thermal shock test, run at a temperature differential of at least 70 K, is the single check that most directly exposes tempering deviations. What matters is coverage: whether it applies to every batch, and whether the pass/fail record carries the same identifier as the batch it came from.
4. Assembly: cap, pin and coupling
Cap and pin quality determines how the disc behaves as part of a string. Ask for the material specification — hot-dip galvanized cast-iron cap and hot-dip galvanized forged steel pin are the common configuration — and for the coupling gauges used at 16, 20, 24 and 28 mm socket sizes, which correspond to different load classes in a typical catalogue. In polluted or coastal service, zinc-sleeve practice is worth raising explicitly, because it slows corrosion of the string hardware.
5. Test, packing and loading
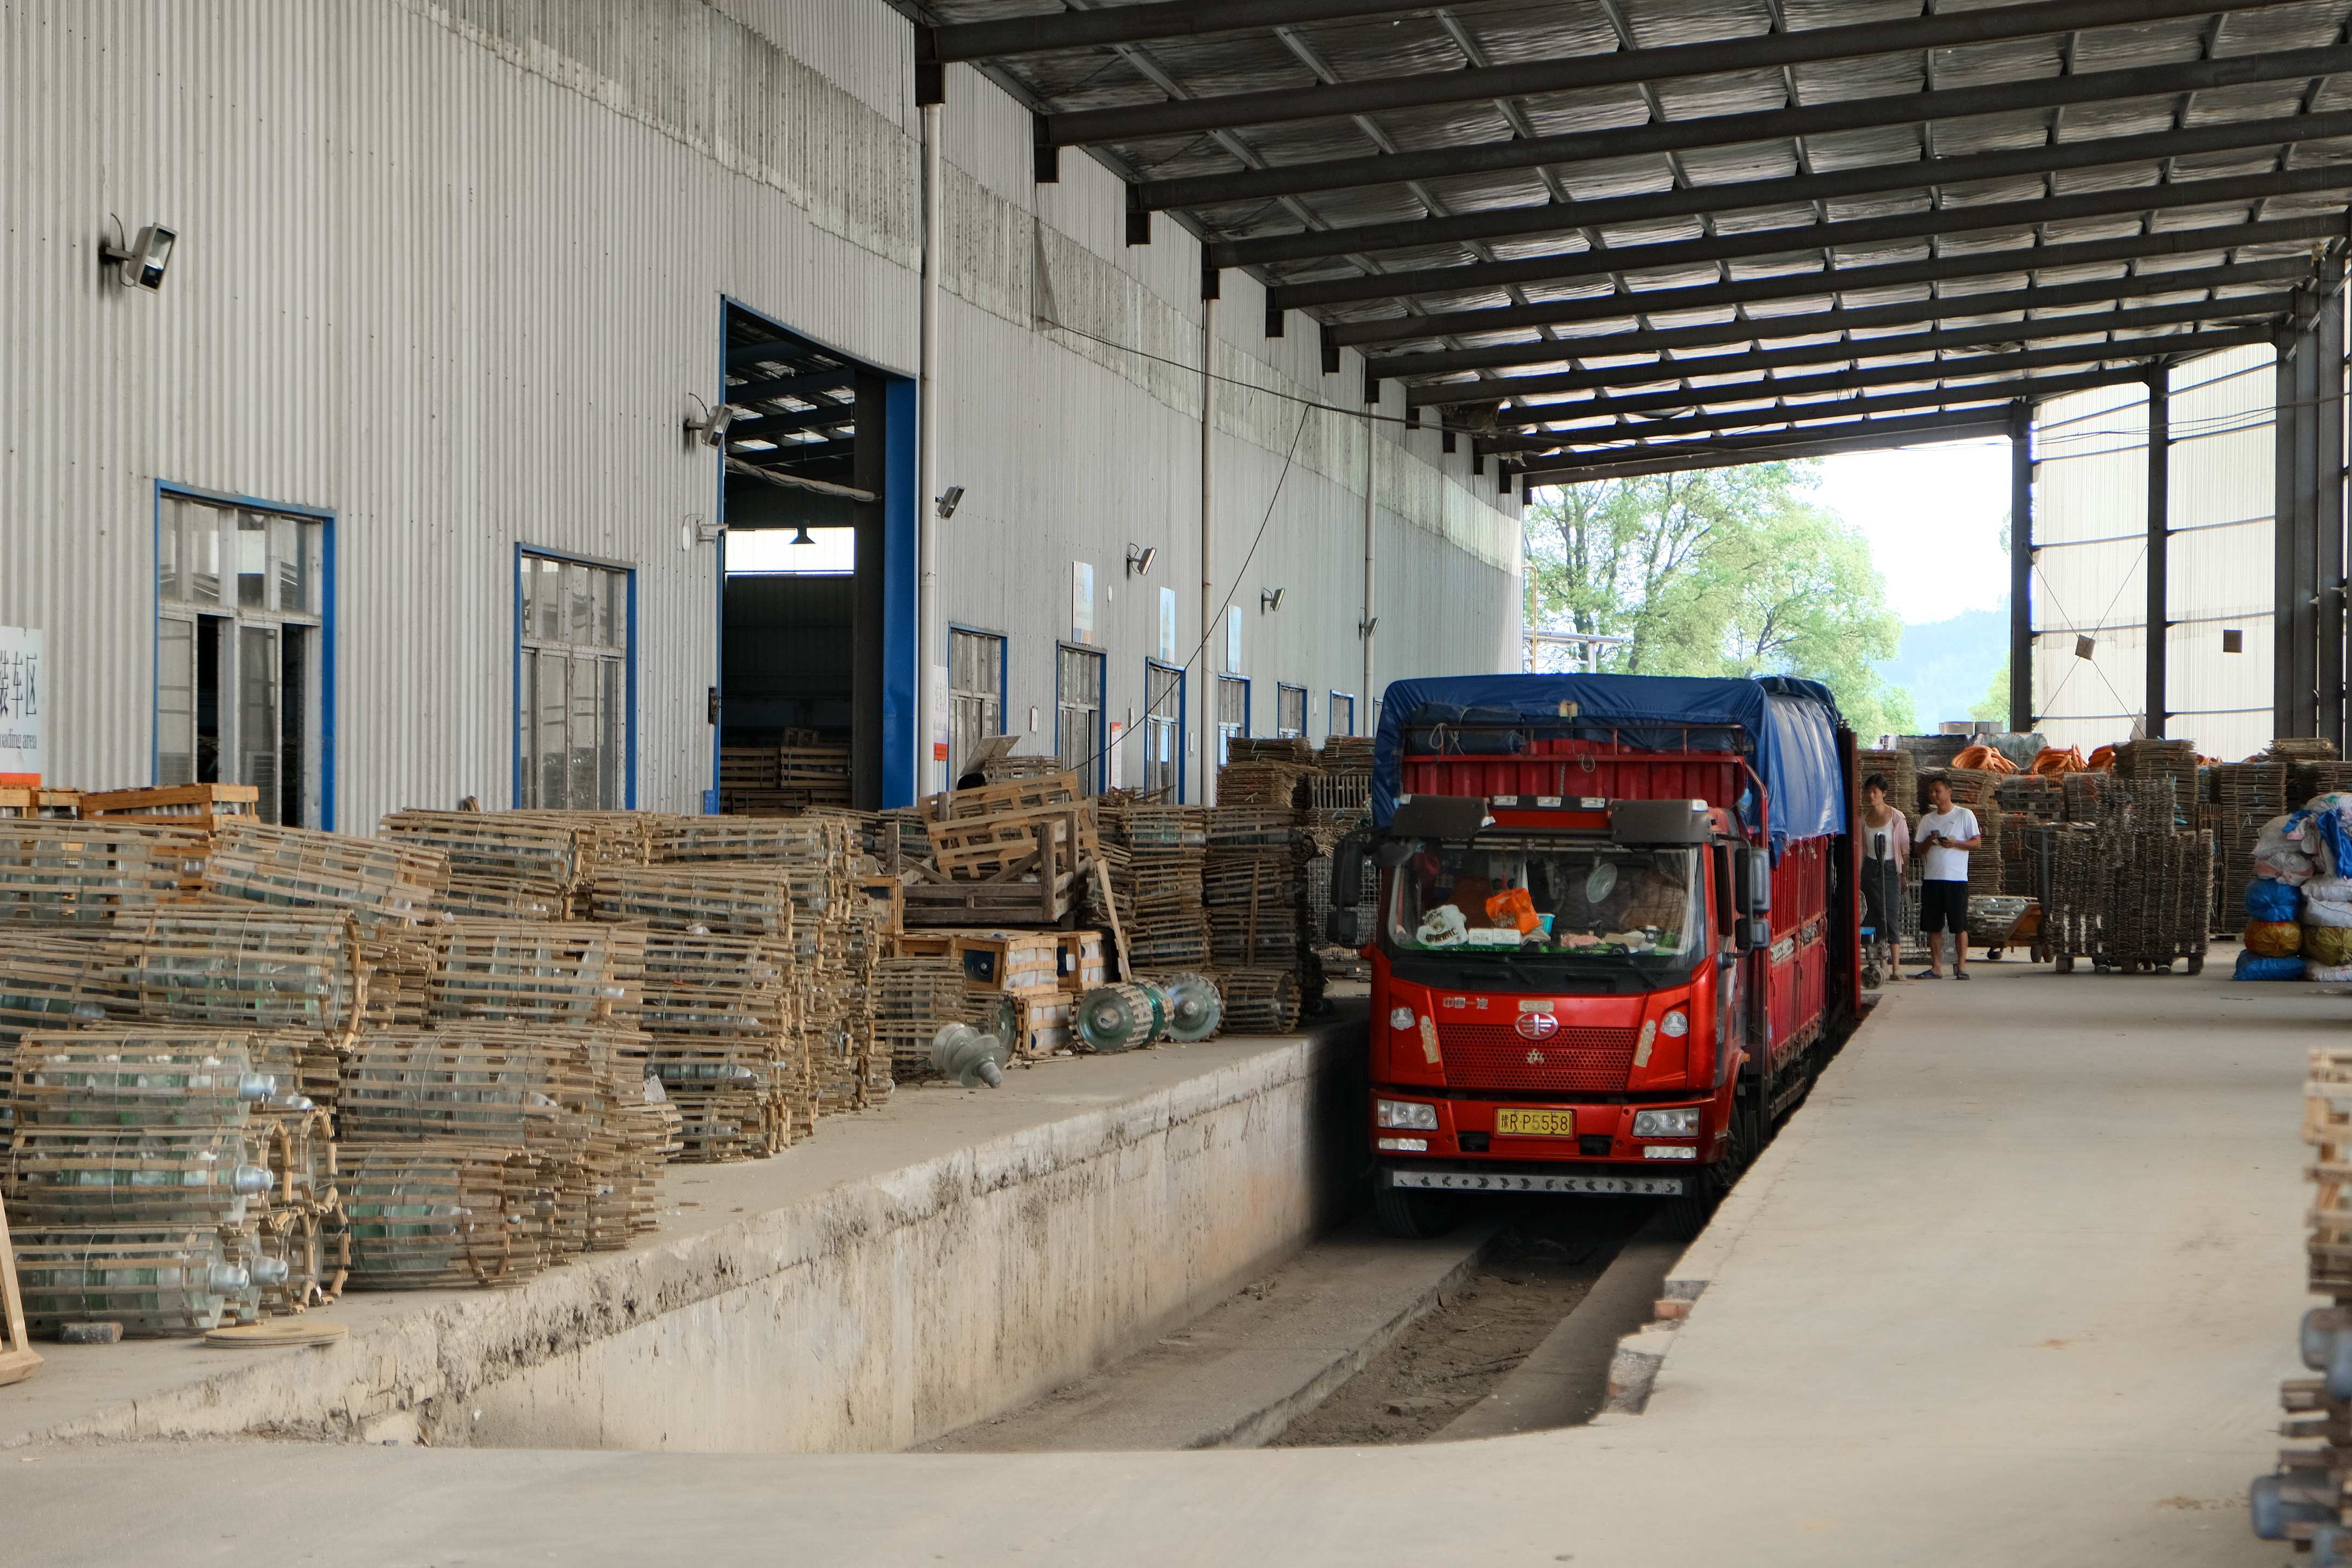
The final gate is where 100% pre-shipment testing and third-party inspection such as SGS intervention are applied. A loading area that keeps crates identified by lot, and that matches dispatch documents to the tested batch, closes the traceability chain. If the chain stops at the warehouse door, the records are only as good as the assumption that nothing was mixed.
Batch Traceability: What a Usable Record Actually Contains
Traceability is often claimed and rarely defined. A record that supports a real procurement decision should connect four data sets without manual reconstruction: the production window (date, shift, line), the tempering and thermal shock results for that window, the inspection and test results, and the dispatch reference of the crate in which the units left the plant.
Two supporting systems usually sit behind this. The first is a management system certificate that can be checked independently. Jiangxi QOCI Electric Co., Ltd. holds a Quality Management System Certificate issued under ISO 9001:2015 with certificate number 00124Q33852R3M/3600 by the China Quality Certification Centre, covering research, development, production and sales of electrical equipment, valid to 14 May 2027, together with an Environmental Management System Certificate (00125E30701R3M/3600, ISO 14001:2015) and an Occupational Health and Safety Management System Certificate (00125S30581R3M/3600, ISO 45001:2018) valid to 24 March 2028.
The second is routine test infrastructure. A supplier operating a 100% pre-shipment test regime and accepting third-party inspection has a mechanism that produces batch-level evidence continuously; a supplier relying on a type-test report has evidence for the design, not for the delivery.
What Consistency Looks Like Across a Load Family
Process control is easiest to judge across a range, because the same line has to hold tolerance while disc diameter, spacing and creepage change with the load class. Jiangxi QOCI Electric Co., Ltd., established in December 2002 and located in the Luxi Industrial Park, Pingxiang City, Jiangxi Province, China, manufactures glass and porcelain insulators for transmission and distribution projects and is a participating unit of the Insulator Standard Committee. Its catalogue spans standard, anti-pollution, double-shed and aerodynamic suspension glass insulator profiles.
| Model | Mechanical failing load | Disc diameter | Nominal spacing | Creepage distance |
|---|---|---|---|---|
| U70B | 70 kN | 255 mm | 146 mm | 320 mm |
| U120B | 120 kN | 255 mm | 127 / 146 mm | 320 mm |
| U160B | 160 kN | 280 mm | 127 / 146 mm | 360 mm |
| U210B | 210 kN | 280 mm | 170 mm | 400 mm |
| U240B | 240 kN | 280 mm | 170 mm | 400 mm |
| U300B | 300 kN | 320 mm | 195 mm | 485 mm |
| U420B | 420 kN | 360 mm | 205 mm | 550 mm |
| U210BP (anti-pollution) | 210 kN | 320 mm | 170 mm | 550 mm |
| U420BP (anti-pollution) | 420 kN | 380 mm | 205 mm | 620 mm |
Profiles in the same line cover standard sheds, anti-pollution variants with extended creepage for saline or industrial environments, double-shed and two-wing designs, and aerodynamic open-shed shapes for high-dust service. Because the same forming and tempering equipment runs all of them, a plant that can show stable inspection data across this range is demonstrating something that a single-model sample cannot demonstrate.
Capacity claims belong in the same evidentiary category. QOCI reports a monthly capacity of 750,000 units against an annual output of 9,000,000 units, lead times of 15 to 35 days on standard profiles, a minimum order quantity of 50 units, OEM and ODM production including voltage and logo customisation, and exports to the EU, US, Middle East, Asia, Africa and South America. Each of these numbers can be cross-checked on a line visit against forming throughput, heat-treatment cycle time and dispatch scheduling.
Comparison: How Glass Changes the Inspection Model — and Where It Stops Being the Answer
The choice between glass and porcelain is not a quality ranking; it is a difference in failure mode and, therefore, in inspection economics.
| Dimension | Suspension glass insulator | Porcelain insulator |
|---|---|---|
| Failure visibility | Electrical failure triggers self-breaking of the disc, visible from ground patrol | No visible external change on electrical failure |
| Field inspection method | Visual patrol; no live-line zero-value testing required | Live-line climbing and piece-by-piece testing |
| Surface behaviour in dust | Smooth surface shows slower dust accumulation and self-cleaning in desert conditions | Requires more frequent cleaning in comparable dust loading |
| Chemical exposure | Tempered glass is less suited to sustained acid, alkali or solvent attack | Chemical inertness is superior |
The boundary is worth stating plainly. Self-breaking is a designed fail-safe behaviour, not an absence of risk: a broken disc retains mechanical load capacity through the cap and pin but loses electrical insulation, and it must be replaced during the next scheduled maintenance window. Buyers evaluating glass should therefore look for evidence that tempering is controlled tightly enough to keep self-breaking infrequent — the industry benchmark for controlled production is below 0.02% per year — rather than assuming that a visible failure mode removes the need for process discipline. In chemically aggressive environments, porcelain remains the more appropriate material.
What a Plant Visit Cannot Prove
Audit evidence has limits, and a procurement team should name them before signing.
- Latent inclusions. Visual and dimensional inspection cannot detect every internal defect, such as nickel-sulphide inclusions, before a disc fails. Residual stress measurement and inclusion analysis on broken samples are the tools for that question.
- Sample versus population. A witnessed test proves the units tested. It does not automatically extend to units produced on a different shift or with a different glass batch unless traceability links them.
- Time compression. A one-day visit cannot substitute for service history. Field data covering at least three years is the minimum credible basis for a long-term reliability claim.
- Commercial continuity. Process control says nothing about whether a supplier can maintain delivery schedules through a capacity crunch; that is a supply-chain question, answered with records rather than with equipment.
Where a plant visit is used honestly, it reduces uncertainty rather than eliminating it.
Closing the Loop: Field Evidence from Central Asia
Process evidence and field evidence reinforce each other. In projects supplied to a national grid corporation and a power transmission EPC contractor across Uzbekistan, Ukraine and Iraq, glass insulator units were installed for UHV/EHV overhead line insulation and grid construction in desert and industrial pollution zones. The reported programme scale was 200,000 pieces in total — 80,000 in Uzbekistan, 70,000 in Ukraine and 50,000 in Iraq — with delivery windows of two years for Uzbekistan and three years each for Ukraine and Iraq, running until 2026.
Project-reported outcomes include zero line-tripping incidents, a 70% reduction in maintenance costs, pollution flashover incidents reduced by 85% against a porcelain baseline, and 100% visual defect detection without live-line testing. The same project documentation records verified operation from -40°C to +55°C in Uzbekistan and Iraq, mechanical reliability demonstrated at 550 kN tensile strength, self-cleaning behaviour in desert conditions, and a designed service life exceeding 30 years.
For a buyer, the useful part of this record is not the headline result but the structure behind it: a specified load class, a defined pollution environment, a documented inspection method and a measurable maintenance outcome. That structure is what makes the claim checkable — and it is the same structure that a well-run plant visit is designed to test.
Market Trend: Demand Is Moving Toward Verifiable Process Control
Several published indicators point in the same direction. Asia Pacific accounted for a revenue share exceeding 52% of the glass insulator market in 2024, driven largely by grid expansion in China and India, while China concentrated 31.4% of global electrical insulator exports in 2024, a total of USD 898 million (OEC). Export growth has been uneven by destination; electrical insulator exports from China to Saudi Arabia grew by 219% between 2023 and 2024, making it the fastest-growing market in that dataset.
The supplying landscape is concentrated among a small number of global manufacturers, including Sediver (Seves Group), Nanjing Electric and Zhejiang Jinlihua Electric, alongside a wider tier of Chinese producers. Concentration at the top and expansion at the base put pressure on the middle: suppliers that cannot demonstrate process evidence increasingly compete on price alone.
Two practical trends follow. First, buyers are shifting inspection earlier in the relationship — pre-award line visits and witnessed batch testing rather than post-delivery sampling. Second, third-party inspection is becoming a contracting norm rather than an exception, which raises the value of plants that already operate batch-linked records.
Future Outlook
The next stage of competition in suspension glass insulators is likely to be about documentation rather than geometry. As long-distance lines are built through desert, high-pollution and hard-to-inspect corridors, the value of a visible failure mode increases, and with it the value of proving that tempering is controlled batch by batch. Suppliers that can hand a visiting engineer a complete lot file — thermal shock results, residual stress measurements, inspection data and dispatch records under one identifier — will be easier to qualify, easier to defend in an audit, and easier to keep in a long-term supply programme. That is a slower kind of differentiation than a specification sheet, but it is the kind that survives contact with a field installation.
Frequently Asked Questions
What should an engineer check first during a suspension glass insulator factory visit?
Start with lot-linked thermal shock test records rather than the showroom. IEC 60305:2021 fixes the mechanical and electrical characteristics of these units, so specification compliance is a baseline; the thermal shock test, run at a temperature differential of at least 70 K, is the check that most directly exposes tempering deviations. Records should carry the same identifier as the production batch they came from, and they should be followed by residual stress measurement data before any conclusion is drawn about process control.
How can a buyer verify that thermal shock testing is actually performed on every batch?
Three checks work together: coverage, linkage and equipment calibration. Coverage means the test applies to routine production batches rather than only to type-test samples. Linkage means recorded results trace to forming dates, tempering runs and packed crates. Calibration means the test equipment itself carries valid calibration records. A supplier able to show only an external type-test report has evidence of design validation; a supplier able to show batch records has evidence of production consistency.
What is the self-breaking rate of toughened glass insulators, and can a broken unit stay in service?
The industry benchmark for qualified products from manufacturers with controlled tempering is below 0.02% per year. A self-broken disc retains its mechanical load-bearing capacity through the metal cap and pin but loses electrical insulation, so it should be replaced at the next scheduled maintenance window. Because the break is visible from ground patrol, no live-line testing is needed to identify it.
Do glass insulators require live-line zero-value testing?
No. The self-breaking mechanism makes an electrically failed glass unit visually identifiable, so routine visual patrol is sufficient for fault detection. Porcelain and composite insulators do not change visibly when a unit fails electrically, which is why they require live-line climbing and piece-by-piece zero-value testing. Glass still requires replacement of broken units; the difference is in detection cost, not in the need for maintenance.
How should a procurement team evaluate a toughened glass insulator supplier?
Evaluate five areas: load-class coverage across the specified mechanical range; IEC 60305 type-test certification; thermal shock test pass rates with batch-level documentation; self-breaking and replacement data drawn from at least three years of field operation; and production capacity against required lead time, including export packaging quality. Where a supplier quotes capacity, lead time and minimum order quantity, those figures can be cross-checked against forming throughput and heat-treatment cycle time during a plant visit.
Which regions and environments are suitable for glass insulators?
Glass performs well in desert and sandy regions, industrial pollution zones, and long-distance lines that are difficult to inspect, with verified operation from -40°C to +55°C in Central Asian and Middle Eastern projects. Its smooth surface self-cleans better than porcelain under dust-type pollution. In chemically aggressive conditions involving sustained acid, alkali or solvent exposure, porcelain's chemical inertness makes it the better choice — the material selection should follow the pollution type, not a general preference.
Where to Look Next
The evidence described here is checkable on site: forming records, tempering parameters, thermal shock results, coupling gauges and dispatch documentation. Buyers preparing a plant visit or a supplier audit can review the full suspension and anti-pollution glass insulator range, including the U70B to U420B load classes, in the QOCI glass insulator catalogue, and can request the corresponding batch documentation during the audit.
Figures attributed to market research houses, standards bodies and project documentation are reproduced as published by those sources. Project outcomes are reported results from the referenced installations.