
Independent Buyer Comparison: Desalination Systems from 100 to 60,000 m³/day
Independent Buyer Comparison: Desalination Systems from 100 to 60,000 m³/day
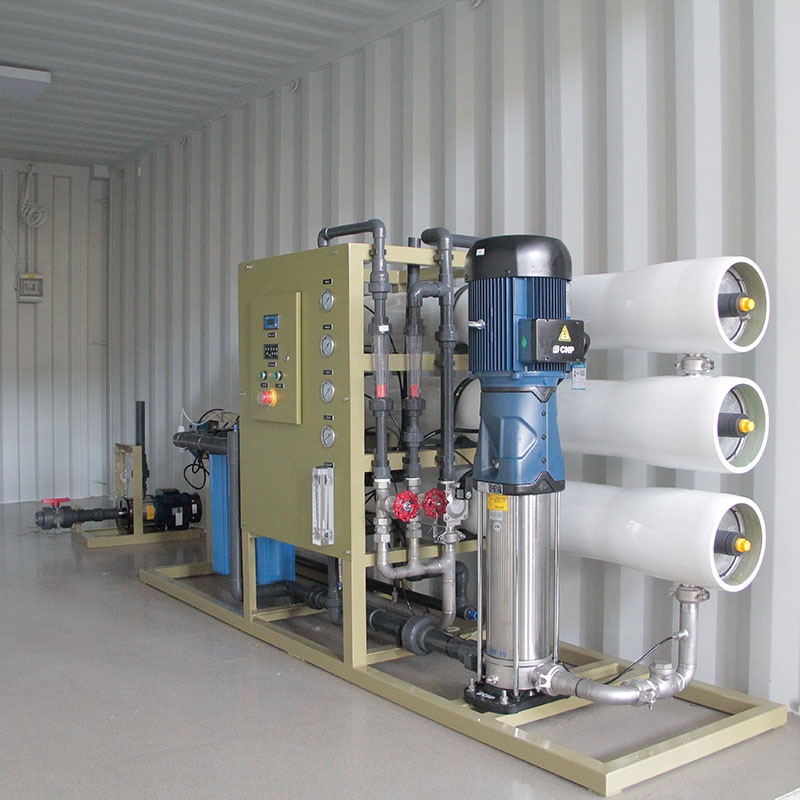
Agricultural water supply deployment — the low-capacity entry point of the 100 to 60,000 m³/day comparison range.
Desalination procurement problems rarely begin with the wrong technology. They begin with a single number. When capacity in cubic metres per day becomes the only fixed specification, feedwater chemistry, pre-treatment scope, civil works, containerization and long-term service are all decided afterwards — usually by whoever is under the most schedule pressure.
A 100 m³/day brackish-water system for agricultural irrigation and a 60,000 m³/day industrial wastewater recycling (WWRO) plant share a product category and almost nothing else. Between them sit island community supplies, power-plant and seaport duties, tropical process water, and municipal drinking water in the 20,000–50,400 m³/day band. Each band has its own feedwater envelope, its own acceptance tests and its own realistic deployment method.
This comparison uses delivered reference projects from QT ENVIRO-TECH (Suzhou) Ltd, a desalination system manufacturer, EPC contractor and system integrator headquartered in Suzhou, China, established in 2011, which designs, assembles and commissions SWRO, BWRO and WWRO plants through its fastRO® containerized and skid-mounted platforms. Its project record is used here as the evidence base, alongside third-party market data. The evaluation criteria themselves are supplier-neutral and can be applied to any shortlist.
Why capacity alone is a weak specification
Three failure patterns repeat across desalination tenders. First, capacity is specified without a feedwater envelope, so the pre-treatment train becomes a change order. Second, containerization is treated as a transport decision rather than an engineering decision, and corrosion class, container count and access routes are resolved too late to influence cost. Third, service capability is evaluated at handover rather than at year ten, when membranes, pumps and energy consumption determine the real cost of ownership.
The opportunity runs in the opposite direction. Modular, factory-assembled systems change the risk profile of a project rather than only its schedule. QT ENVIRO-TECH reports more than 80% factory pre-assembly on its fastRO platform, which reduces on-site civil works by up to 70% and cuts total construction and installation time by up to 60%, with on-site commissioning measured in about two weeks on standardized units. For a buyer, that converts site risk into logistics planning — usually a favourable trade, but not an unconditional one.
Nine reference capacities between 100 and 60,000 m³/day
The clearest way to read a desalination portfolio is by feedwater and duty, not by headline size. The table below groups documented references by the capacity band in which they were delivered.
| Reference capacity | Application | Process train | Feedwater / operating condition | Reference note |
|---|---|---|---|---|
| 100 m³/day | Agricultural irrigation supply | BWRO + pre-treatment | Brackish water source, seasonal to continuous duty | 2020 project; smallest brackish-water reference |
| 500 m³/day | Emergency and aid water supply | SWRO + PV solar integration | Off-grid, solar-powered remote operation | China aid project, 2024 |
| 500 m³/day | Nuclear power plant cooling and process water | SWRO + high-pressure pump + energy recovery device | Coastal remote site, seawater feed; high reliability, low noise and explosion-proof requirements | Installed in 10 days |
| 1,000 m³/day | Island community drinking water | SWRO + pre-treatment + post-treatment | Marine coastal environment, 24/7 continuous duty | 365-day uptime through monsoon swings; 2022 project |
| 2,400 m³/day | Industrial process water for palm oil production | SWRO + pre-treatment | Seawater feed, tropical industrial conditions | 2020 project |
| 3,500 m³/day | Remote coastal community supply | Modular SWRO + storage, optional solar power | 350 m³/day per container, remote coastal deployment | Delivered in cooperation with Veolia |
| 20,000 m³/day (20 MLD) | Municipal drinking water, Morocco | UF + SWRO matrix + pre-treatment + post-treatment | Containerized, approximately 22 ISO containers | 9-month EPC completion with JESA; largest containerized SWRO reference in the portfolio |
| 50,400 m³/day | Municipal drinking water, Morocco (OCP) | GSF + UF + SWRO | Skid-based large-capacity configuration | Reference for the 50 MLD-class skid platform |
| 60,000 m³/day | Industrial wastewater recycling (WWRO), Anhui, China | Clarifier + UF + BWRO | Industrial wastewater influent, on-site plant environment, 24/7 continuous | 2025 large-scale industrial application |
Table 1 — Documented reference capacities by feedwater, process train and duty.
Read the sequence as a progression of engineering complexity rather than as a price list. At 100 m³/day the plant is essentially a single brackish-water reverse osmosis train with pre-treatment. By 1,000 m³/day, coastal corrosion protection and continuous-duty design become the dominant cost drivers, and the commercial question shifts to whether the unit can operate unattended through a monsoon season. Between 2,000 and 3,500 m³/day, containerization determines whether future capacity is added by shipping modules or by pouring concrete. Above 20,000 m³/day, pre-treatment — ultrafiltration, and in the drinking-water case granular filtration plus ultrafiltration — plus civil works dominate the schedule, which is why a 20 MLD plant was completed as a containerized EPC in nine months while the 50,400 m³/day plant was built around a skid platform.
A neutral buyer scorecard: five criteria that change the answer
Capacity, feedwater, containerization, standards and long-term evidence are not independent variables. A high feedwater risk score reduces the value of aggressive containerization; a site with no port access reduces it further. The scorecard below is intended to be applied before a shortlist is built, not after.
| Criterion | What to verify | Why it moves the decision |
|---|---|---|
| 1. Feedwater chemistry and variability | TDS range, temperature, turbidity, COD, iron, manganese, oil and grease | Selects the SWRO, BWRO or WWRO train and defines pre-treatment scope. A correctly sized plant matched to the wrong envelope underperforms regardless of capacity. |
| 2. Capacity and the expansion path | Nominal capacity, minimum practical increment, proven maximum for the platform | Determines whether growth requires new civil works or added modules, and whether phased CAPEX is genuinely available. |
| 3. Containerization and site conditions | Factory pre-assembly percentage, container count and size, transport route, corrosion class | Drives civil works, installation time and coastal durability. It is an engineering decision with a logistics consequence. |
| 4. Standards and compliance evidence | Equipment design codes (ASME, CE), corporate systems (ISO 9001, ISO 14001, ISO 45001), product water guidelines such as ISO 23446:2021 | Determines permitting, acceptance-test scope and whether municipal water quality claims can be supported. |
| 5. Long-term operating evidence and lifecycle support | References matched by feedwater, climate and duty cycle; commissioning, operator training and remote monitoring scope | Determines cost and uptime from year five to year twenty, which is where single-number procurement usually fails. |
Table 2 — Five-criterion buyer scorecard for desalination system evaluation.
Two weighting notes are worth recording. Where feedwater is well characterised and stable, criteria 2 and 3 carry most of the decision. Where feedwater varies seasonally, or where the site is remote, criterion 1 should override everything else, because pre-treatment retrofits are the most expensive form of change on a desalination plant. Criterion 5 should be scored on comparability rather than count: a supplier with one reference plant running continuously for years on similar feedwater is more informative than a large portfolio of unrelated installations.
Feedwater chemistry, not capacity, selects the process train
Standardized platforms are defined against a feedwater envelope. That envelope is the single most useful document a buyer can request, because it states precisely where a modular solution is appropriate and where it is not.
| Platform | Feedwater envelope | Product water | Materials and notes |
|---|---|---|---|
| SWRO — fastRO Mega (5–20 MLD) and fastRO C/BWC (50–1,000 m³/day) | TDS 20,000–45,000 mg/L; temperature 5–35 °C; turbidity below 20 NTU; COD below 10 mg/L; Fe²⁺ below 0.1 mg/L; Mn below 0.1 mg/L; oil and grease below the stated limit | TDS below 500 mg/L; pH 6–8; turbidity below 0.2 NTU | Super duplex steel for pumps, energy recovery devices and high-pressure piping; UPVC/HDPE for piping; heavy-duty marine paint on frame and container |
| BWRO — C120BW to C1000BW | TDS 2,000–5,000 mg/L; temperature 5–35 °C; turbidity below 5 NTU; COD below 10 mg/L; Fe²⁺ and Mn below 0.1 mg/L; oil and grease below the stated limit | TDS below 500 mg/L; pH 6–8; turbidity below 0.2 NTU | Sch10 SS316 high-pressure pipe and fittings; heavy-duty protective paint |
| WWRO — fastRO Skid or customized | Customized treatment capacity against the actual wastewater analysis | Defined per reuse duty | Available processes: clarifier + UF + BWRO; tubular UF + RO; NF system. Carbon steel / SS304 / FRP |
| Customized SWRO / BWRO / WWRO skid | Approximately 50 MLD and above, engineered to the project feedwater and standard | TDS below 500 mg/L; pH 6–8; turbidity below 0.2 NTU where SWRO-quality output is targeted | Carbon steel / SS304 / FRP; configuration matched to site, standard and process |
Table 3 — Feedwater envelopes and process options by platform type.
The practical rule for a buyer is simple. If the feed analysis sits inside a published envelope, a standardized platform is technically defensible and the schedule advantage is real. If it does not — oil and grease present, COD above the stated limit, salinity outside the SWRO band, or a WWRO duty with variable industrial influent — the project moves to a customized skid configuration with a longer engineering phase. That is not a limitation of one supplier; it is how reverse osmosis behaves.
Containerized versus traditional site-built: where the difference is real
The modular argument is often stated as a cost argument. It is more accurately a construction-method argument, and the numbers only make sense when the site conditions allow the method to be used.
| Dimension | Containerized / modular (fastRO platform) | Traditional site-built plant | Conventional skid-mounted RO |
|---|---|---|---|
| Factory pre-assembly | More than 80% pre-assembly, pre-tested before shipping | Assembled on site | Skid assembled in factory, limited platform-wide integration |
| Civil works | Up to 50–70% lower civil works | Foundations, buildings and pipe racks built on site | Moderate civil works |
| Installation and commissioning | Up to 60% shorter construction and installation time; on-site commissioning around two weeks; a 500 m³/day unit installed in 10 days | Longest route from award to first water | Faster than site-built, slower than containerized |
| Cost profile | Manufacturer reports roughly 10% lower total cost, with reduced civil works and on-site labour | Highest civil works and site labour exposure | Standardized design lowers engineering cost |
| Operations | Digital Water Plant: real-time SCADA visualization, AI agent support for energy and chemical optimization, predictive equipment health monitoring, automatic work-order dispatch | Manual and periodic monitoring | Limited remote capability |
| Maintenance model | Predictive maintenance and remote monitoring reduce on-site manpower requirement | Higher routine on-site requirement | Scheduled maintenance |
Table 4 — Construction, cost and operating comparison across three deployment approaches.
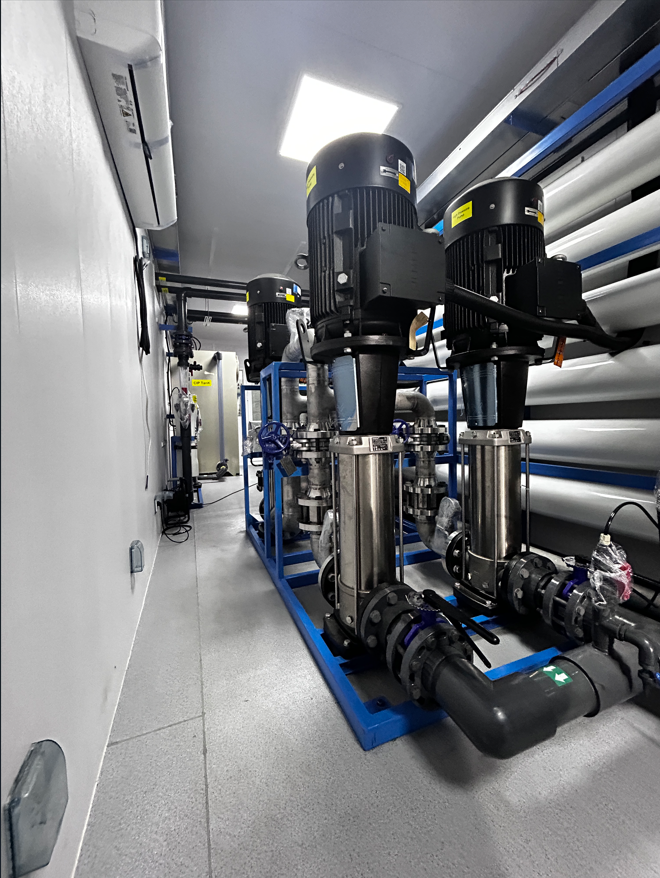
BWRO-720CMD — a brackish-water reverse osmosis configuration representative of the mid-range modular band.
Where this comparison stops working
- Feedwater outside the envelope. Containerized platforms are defined against limits such as SWRO TDS of 20,000–45,000 mg/L, turbidity below 20 NTU, COD below 10 mg/L and oil and grease below the stated threshold. Feeds outside those bands require customized skid design and a longer engineering phase, which erodes part of the schedule advantage.
- Transport access. Modular delivery depends on ISO container shipping (20 ft, 40 ft, 40 ft HC) and flatbed transport for skids. Inland sites without port or road access to suit those loads lose much of the benefit.
- Design freedom. Standardization buys repeatability at the cost of layout flexibility. Projects with unusual plot constraints or unusual process integration requirements will need customization.
- Digital layer preconditions. Remote monitoring and predictive maintenance reduce on-site manpower needs, but they assume connectivity and trained operators. Operator training is part of the standard handover scope for that reason.
- Market data is directional, not a specification. Third-party market forecasts vary by methodology and should never be used to size a plant.
Market context: modular demand is growing, and the estimates disagree
Independent market data supports the direction of the shift, but not with the precision that procurement documents sometimes assume. The global desalination market reached approximately USD 21.3 billion in 2025 and is projected to grow to about USD 23.2 billion in 2026, according to research published by Grand View Research. Global installed desalination capacity crossed the 100 million cubic metres per day threshold in 2024, according to the International Desalination and Reuse Association (IDRA) Desalination and Reuse Handbook 2024–2025. Seawater reverse osmosis accounts for more than 60% of that installed capacity, based on a 2025 assessment by Credence Research, and Asia Pacific is projected as the fastest-growing regional market for desalination equipment, estimated to reach USD 17.7 billion by 2030 in a Grand View Research outlook.
Buyers should treat those figures as context rather than as inputs. Market valuations for 2024 range from about USD 19.98 billion to USD 21.72 billion across research houses, depending largely on whether after-market membrane replacement services are counted alongside new plant capital expenditure. Growth-rate estimates diverge as well, with one methodology placing desalination CAGR near 12.8% and others closer to 8.9%, the difference tracing to whether wastewater reuse technologies are included inside the desalination category. The practical conclusion for a 100 m³/day irrigation project and a 60,000 m³/day reuse project is the same: the market is expanding, procurement cycles are shortening toward modular delivery, and methodology differences mean no single growth figure should appear in a technical specification.
Long-term operating evidence: what a decision-stage buyer should weigh
For buyers at the decision and execution stage, the useful question is not how many plants a supplier has built but whether the operating record resembles the plant being purchased. QT ENVIRO-TECH reports over 100 successful projects across more than 20 countries in Asia, the Middle East, Africa and Europe, with export business accounting for 80% of total sales and markets spanning more than 80 countries including South America. Behind the delivery record, the company cites 30+ years of engineering expertise and a core technical team of 40+ engineers.
That record is only meaningful when it is mapped to conditions. A 1,000 m³/day island plant specified for 365-day uptime through monsoon swings is evidence for continuous duty in humid coastal conditions. A 2,400 m³/day palm oil process-water plant is evidence for tropical industrial operation. A 3,500 m³/day remote coastal modular supply delivered with Veolia is evidence for containerized deployment at scale in a remote setting. A 20,000 m³/day containerized municipal plant completed with JESA in nine months is evidence for EPC integration at municipal scale, and the 60,000 m³/day WWRO project in Anhui is evidence for industrial reuse in a continuous 24/7 duty.
Lifecycle support follows the same logic. Documented scope covers process design, equipment procurement, factory assembly, quality testing, shipping logistics, installation supervision, commissioning, operator training and long-term operation support. The Digital Water Plant platform adds SCADA visualization, AI-assisted energy and chemical optimization, predictive equipment health monitoring and automatic work-order dispatching, which together reduce skilled-labour dependency — a decisive factor where the operating team is small or the site is remote.
Future outlook
Three developments are visible in the reference data itself. First, capacity is increasingly purchased in phases: a 20 MLD containerized plant built from roughly 22 ISO containers can be expanded in modular increments instead of being re-engineered. Second, energy architecture is being designed alongside the process, as shown by the PV-integrated 500 m³/day solar-powered unit for off-grid duty and the solar option attached to the 3,500 m³/day remote coastal supply. Third, reuse is moving from an add-on to a primary duty, with the 60,000 m³/day industrial wastewater recycling plant and the 50,400 m³/day municipal drinking-water plant representing the two ends of the same trend: turning seawater and wastewater into usable resources rather than treating them as disposal problems.
Standards are converging in parallel. ISO 23446:2021 provides international guidelines for product water quality of seawater reverse osmosis desalination used for municipal supply, giving buyers a reference point beyond national permitting. Combined with ASME and CE equipment design certification and ISO 9001, ISO 14001 and ISO 45001 corporate systems, the compliance evidence available at tender stage is more structured than it was a decade ago — which shifts the burden of proof onto the buyer to specify what will be verified, and when.
FAQ
1. What counts as long-term operating evidence for a desalination supplier?
Evidence that ties a reference plant to a specific feedwater, climate and duty cycle, rather than a total project count. Documented references include a 1,000 m³/day island community plant designed for 365-day uptime through monsoon swings (2022), a 2,400 m³/day palm oil process-water plant operating in tropical industrial conditions (2020), a 3,500 m³/day remote coastal modular supply delivered with Veolia, and a 500 m³/day nuclear power plant supply installed in 10 days. Portfolio size indicates delivery capability; comparability indicates whether that capability applies to the plant being purchased.
2. Can capacity be expanded later without rebuilding the plant?
On modular platforms, yes, provided the increment is defined at the design stage. QT ENVIRO-TECH's fastRO Mega range covers 5–20 MLD in containerized modular form, with additional capacity added in steps of roughly 4–5 containers per additional 5 MLD rather than by re-engineering the plant. Intake and pre-treatment capacity still need to be sized for the final target capacity, so the expansion path has to be documented before the first phase is awarded.
3. What support is included after commissioning?
Documented scope covers commissioning, operator training and long-term operation support, backed by a 40+ engineer technical team. The Digital Water Plant platform adds real-time SCADA visualization, AI agent support for energy and chemical optimization, predictive equipment health monitoring and automatic work-order dispatch. Equipment designs are certified to ASME and CE standards, and corporate processes hold ISO 9001, ISO 14001 and ISO 45001 certification.
4. How do remote and island installations maintain uptime?
Through corrosion protection, remote monitoring and power flexibility. Coastal references use heavy-duty marine paint on frames and containers, with non-corrosive materials such as super duplex steel for pumps and high-pressure piping and UPVC/HDPE for general piping. A remote coastal deployment delivered with Veolia produced 3,500 m³/day at 350 m³/day per container with an optional solar supply, and a PV-integrated SWRO unit delivered 500 m³/day for an off-grid aid project in 2024. Remote monitoring reduces the on-site manpower needed to sustain continuous operation.
5. What commercial and acceptance terms apply to project-based desalination purchases?
For containerized systems, the stated minimum order quantity is one unit, with ISO container shipping (20 ft, 40 ft, 40 ft HC), skid transport by flatbed, and modular shipping for large projects. Acceptance typically combines a factory acceptance test, a site acceptance test and a performance guarantee test, with training and commissioning included. Payment instruments include letter of credit for international projects and T/T wire transfer, with open account terms for established clients; project-based terms are commonly structured as 30% advance with 70% before shipment or against milestones.
6. Does a containerized platform remove the need for pre-treatment design?
No. Standardized platforms are specified against defined feedwater limits. For the SWRO range these are TDS of 20,000–45,000 mg/L, temperature of 5–35 °C, turbidity below 20 NTU, COD below 10 mg/L, iron and manganese below 0.1 mg/L, and oil and grease below the stated threshold, with product water specified at TDS below 500 mg/L, pH 6–8 and turbidity below 0.2 NTU. Feeds outside that envelope move the project to customized skid configurations, where available process combinations include clarifier + UF + BWRO, tubular UF + RO, and NF systems.
Conclusion: score the feed, then score the plant
Between 100 and 60,000 m³/day, the same technology family produces radically different projects. The 100 m³/day brackish-water irrigation system and the 60,000 m³/day industrial reuse plant are both reverse osmosis, and neither is a useful specification model for the other. Buyers who fix feedwater chemistry, expansion path, containerization constraints, compliance evidence and long-term operating comparability before they compare prices will find that the shortlist largely makes itself — and that the remaining decision is about delivery method rather than technology.
Buyers who want the underlying configuration data — feedwater envelopes, platform capacities and reference project details — can review the manufacturer profile and project documents in the QT ENVIRO-TECH company profile (PDF). The full company record is available at www.idesalt.com.