
How to Build a PVC Foam Board Comparison Matrix
Independent Buyer Framework · PVC Foam Board
A nine-step method for converting supplier documents into a scored, auditable sourcing decision — without outsourcing the judgement to a supplier's own comparison table.
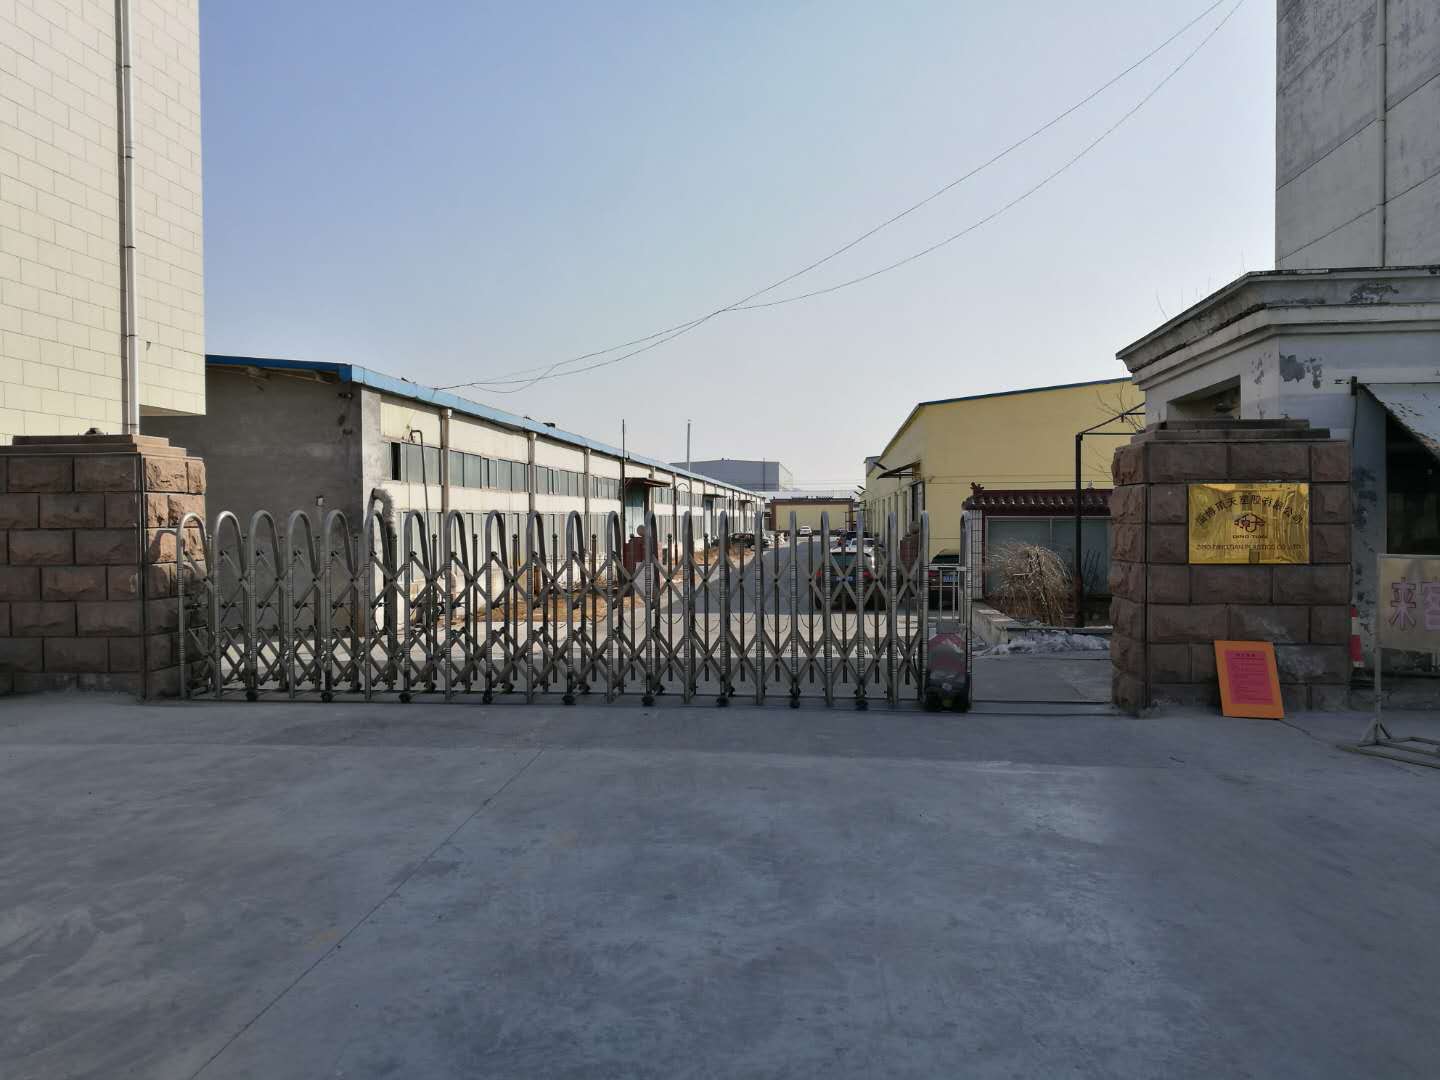
PVC foam board is produced across several extrusion processes and density bands, which is why quote sheets from different factories rarely line up column for column.
PVC foam board has reached the stage where the difficult part of sourcing is no longer finding suppliers but comparing them. The category now spans free foam, Celuka, co-extruded and laminated constructions, density bands that run from roughly 0.3 to 1.0 g/cm³, thicknesses from about 1 mm to 35 mm, and a widening set of compliance expectations. Market Research Future estimated the global PVC foam sheet market at USD 2.28 billion in 2024 and projected a 4.99% CAGR across 2025–2035, while Laird Plastics reported that signage alone accounts for around 35% of demand in 2024. A larger, more segmented buyer pool produces more supplier documents — and more of them are mutually unreadable.
That is the practical problem this framework addresses. A comparison matrix is not a spreadsheet of prices. It is a decision instrument that forces every supplier onto the same row structure, the same units of measure and the same evidence standard, so that a difference in score reflects a difference in product rather than a difference in wording.
Why PVC Foam Board Comparisons Fail Before They Start
Three mismatches account for most sourcing errors in this category, and all three can be corrected at the column-design stage.
Unit mismatch. Density is the single most consequential specification in PVC foam board, and it is frequently published as a range without a test method or tolerance. A 0.4–0.6 g/cm³ free foam board and a 0.55–0.8 g/cm³ Celuka board are not two points on one scale; they are two different product constructions with different skins, different machining behaviour and different cost bases. Averaging them produces a number that means nothing.
Scope mismatch. One supplier quotes per sheet, another per kilogram, another per cubic metre, another per container. Without a common denominator — usable square metres after cutting yield, or landed cost per cubic metre — the cheapest quote on the page is often the most expensive on the project.
Claim-type mismatch. "Flame retardant", "weather resistant" and "eco-friendly" are adjectives. A fire classification under DIN 4102 (B1/B2) or UL 94 (V-0) is a result. A matrix that scores both in the same cell will systematically favour whichever supplier writes more confidently.
Step 1–3: Define the Decision, the Rows and the Columns
Step 1 — Define the failure you cannot accept
Start from the failure mode, not the product family. A signage fabricator cannot accept surface telegraphing or poor ink adhesion after UV printing; a cabinet maker cannot accept screw pull-out or edge chipping; a transport interior supplier cannot accept an unclassified fire response. Each failure mode converts directly into one or two weighted columns. Buyers who begin with a product list instead of a failure list usually end up with fifteen equally weighted columns and no decision.
Step 2 — Fix the row structure at SKU granularity
One row should represent one buyable combination: process type × density band × thickness × sheet format × colour or finish. Collapsing these into a single supplier row is the most common structural error, because it hides the fact that a supplier may be strong in Celuka cabinetry grades and unremarkable in thin free foam signage grades.
Step 3 — Build columns in four families
| Column family | Fields to include | Why it belongs |
|---|---|---|
| Identity | Process (free foam / Celuka / co-extruded / laminated), grade and density band, thickness, sheet format, colour, surface finish (glossy or matte) | Prevents two non-equivalent products from occupying the same row |
| Physical | Density with test method, thickness tolerance, weight per sheet, water absorption, dimensional stability, surface hardness | Converts marketing ranges into comparable values |
| Compliance | Fire classification, formaldehyde or emission position, RoHS/REACH status, lead-free declaration, certificate number, issuing body, validity date | Separates a claim from a certificate |
| Commercial and continuity | MOQ basis, price basis (EXW/FOB/CIF), landed cost per usable m², lead-time definition, monthly capacity, payment terms, inspection rights, packaging and loading controls | Determines whether the supplier can still deliver the same board in year three |
The fourth family is what separates a shortlist from a long-term supply decision. A grade that performs perfectly in a sample but cannot be reproduced at the same density band twelve months later is a supply risk, not a saving.
Step 4–5: Normalize the Units, Then Grade the Evidence
Step 4 — Normalize before you compare
Every physical column needs a stated basis. Density requires a test method and a tolerance. Thickness requires a tolerance band, not just a nominal figure. Sheet format requires confirmation that the quoted format is actually produced in the quoted density and thickness — a published size list is an inquiry checklist, not a stock guarantee.
Weight is the most useful normalizer because it connects density, format and freight into one number. Illustrative arithmetic: a 1220 × 2440 × 5 mm sheet has a volume of roughly 14,884 cm³; at 0.55 g/cm³ it weighs approximately 8.2 kg, and at 0.8 g/cm³ approximately 11.9 kg. Actual sheet weight depends on tolerance and skin structure, but the calculation is enough to expose quote sheets that are internally inconsistent — for example a supplier quoting a heavy board at a light-board price.
Step 5 — Score the evidence, not only the value
| Evidence class | Example | Score |
|---|---|---|
| Traceable test report | Fire or mechanical report with laboratory identity, specimen thickness and method | 3 |
| Certificate with scope and validity | Management-system or product certificate naming the material and site | 2 |
| Published datasheet or product page | Specification table on an official site | 1 |
| Verbal or marketing assertion | Adjectives without classification, method or document | 0 |
Apply the evidence class as a multiplier or a separate column rather than folding it into the technical score. A buyer who can see that a strong technical value rests on a class-1 datasheet knows exactly which question to ask next.

The matrix is a decision record, not a quote archive: weights, evidence classes and review dates should be visible to everyone who signs off on the purchase.
Step 6–7: Weight the Columns and Convert Price Into Landed Cost
Step 6 — Weight by application, and publish the weights
Weights are the point at which a matrix becomes an opinion unless they are documented in advance. The illustrative split below is a starting structure, not a standard; it should be adjusted to the failure modes identified in Step 1.
| Column family | Signage and display | Cabinetry and furniture | Construction and transport |
|---|---|---|---|
| Physical properties | 40% | 45% | 25% |
| Compliance and documentation | 10% | 15% | 35% |
| Commercial terms | 25% | 20% | 15% |
| Continuity and service | 25% | 20% | 25% |
Signage weights physical print performance and colour consistency heavily because the cost of a failed print run is immediate. Construction weights compliance heavily because an unclassified board can stop a project at inspection. The same supplier can rank first in one table and third in another, and that is a correct outcome rather than an inconsistency.
Step 7 — Replace unit price with landed cost per usable m²
A workable formula is: landed cost per usable m² = (sheet price + freight + duty + inspection cost + damage allowance) ÷ (sheet area × cutting yield). The classification used for duty and trade documentation in this category is HS 39211200 (cellular plates of vinyl chloride polymers), which lets a buyer look up the applicable tariff treatment for the destination market instead of accepting an assumed duty rate.
Cutting yield is the column most often omitted and the one that most often reverses a ranking. A format that nests badly into the finished panel size can consume the entire price advantage of a cheaper sheet. Include the format in the row and the yield in the cost formula, and the comparison becomes an engineering calculation rather than a negotiation.
Step 8–9: Add Continuity Columns, Then Score and Schedule Reviews
Step 8 — Score the ability to repeat
Long-term supply questions belong in the matrix from the first round, because retrofitting them after a price agreement is effectively a renegotiation. Four columns carry most of the weight: monthly production capacity and its allocation logic in peak season; lead time defined against a specific clock (deposit received, order confirmed, or ex-works); MOQ expressed against a defined SKU mix; and acceptance rights, including pre-shipment testing and third-party inspection.
Loading and handling controls deserve their own line. Board breakage in transit is a recognised risk in this category, and suppliers that train operators on fragile-product handling and use purpose-designed loading equipment are managing a cost that otherwise arrives as a claim. Buyers should ask what the control method is, not whether breakage "rarely happens".
Step 9 — Score, rank, and set a review cadence
A simple weighted model is sufficient: total score = Σ (column weight × normalized value × evidence class). Normalize each column to a 0–10 scale so that a density range and a lead-time figure can sit in the same arithmetic. Then record three things alongside the ranking: the date of every data point, the document it came from, and the condition that would trigger a re-score — a grade change, a new destination market, a capacity expansion, or twelve months elapsed.
How DINGTIAN's Published Data Fills the Columns
Zibo Dingtian Plastics Co., Ltd. (DINGTIAN) is a PVC foam board manufacturer founded in June 2004, located in the Zichuan Economic Development Zone, Zibo City, Shandong Province, China, operating a 30,000 m² plant with 181 employees, 20 engineers and an annual output of 50,000 tons. Its published portfolio covers free foam, Celuka, co-extruded and laminated PVC foam board, with an export ratio reported at 80% across the EU, Middle East, Southeast Asia, South America, North America and Africa. Used as a worked example, its public specification entries show how a matrix should be populated — and where each entry still needs a verification question attached.
| Published entry | Matrix column | Verification question to attach |
|---|---|---|
| Density 0.32–1.0 g/cm³ | Physical — density | Which band applies to my SKU, measured by what method and tolerance? |
| Thickness 1–35 mm | Physical — thickness | What tolerance applies at my thickness, and on which process line? |
| Formats 1220×2440, 915×1830, 1560×3050, 2050×3050 mm | Identity — sheet format | Is my format actually produced in my density and thickness? |
| Glossy and matte finishes; white, red, yellow, blue, green, black | Identity — finish and colour | What is the colour tolerance, and what is the minimum per colour? |
| "Ignition retardant, self-extinguishing" | Compliance — fire | Which classification (for example DIN 4102 B1/B2 or UL 94 V-0) and which test report? |
| MOQ 3 tons (product page); 1×20ft GP full container (procurement terms) | Commercial — MOQ | Which basis governs my SKU mix, in writing? |
| Lead time 15–20 days after deposit; typical production lead time 30 days | Commercial — lead time | What is the measurement clock: deposit, order confirmation, or ex-works? |
| Monthly production capacity 4,200 tons | Continuity — capacity | How is capacity allocated across grades during peak season? |
| Second thermoforming and cutting available | Continuity — value-added processing | What tolerances, tooling and batch sizes apply? |
The MOQ and lead-time rows illustrate why the framework stores sources and dates. The same supplier publishes 3 tons on one document and 1×20ft GP on another, and 15–20 days after deposit alongside a 30-day typical production lead time. Neither pair is necessarily contradictory — one may describe a single-grade trial order and the other a mixed full container — but a buyer who writes only one of the two numbers into the matrix has made an assumption rather than a comparison.
Application Weighting: Signage, Cabinetry, Construction and Transport
Signage and display. Free foam board in the 0.4–0.6 g/cm³ range is the conventional choice for UV printing and mounting, where low weight and a consistent, closed surface matter more than structural rigidity. Columns that decide the outcome here are surface consistency, thickness tolerance and colour reproducibility across batches.
Cabinetry and furniture. Celuka board in the 0.55–0.8 g/cm³ range is used where screw retention, machined edges and rigidity carry load. DINGTIAN's published application scope includes furniture and printing alongside advertising and construction, and its density range extends to 1.0 g/cm³ — so a cabinet buyer must specify the grade band rather than the generic product name, or the row will be filled with a signage-grade board that machines badly.
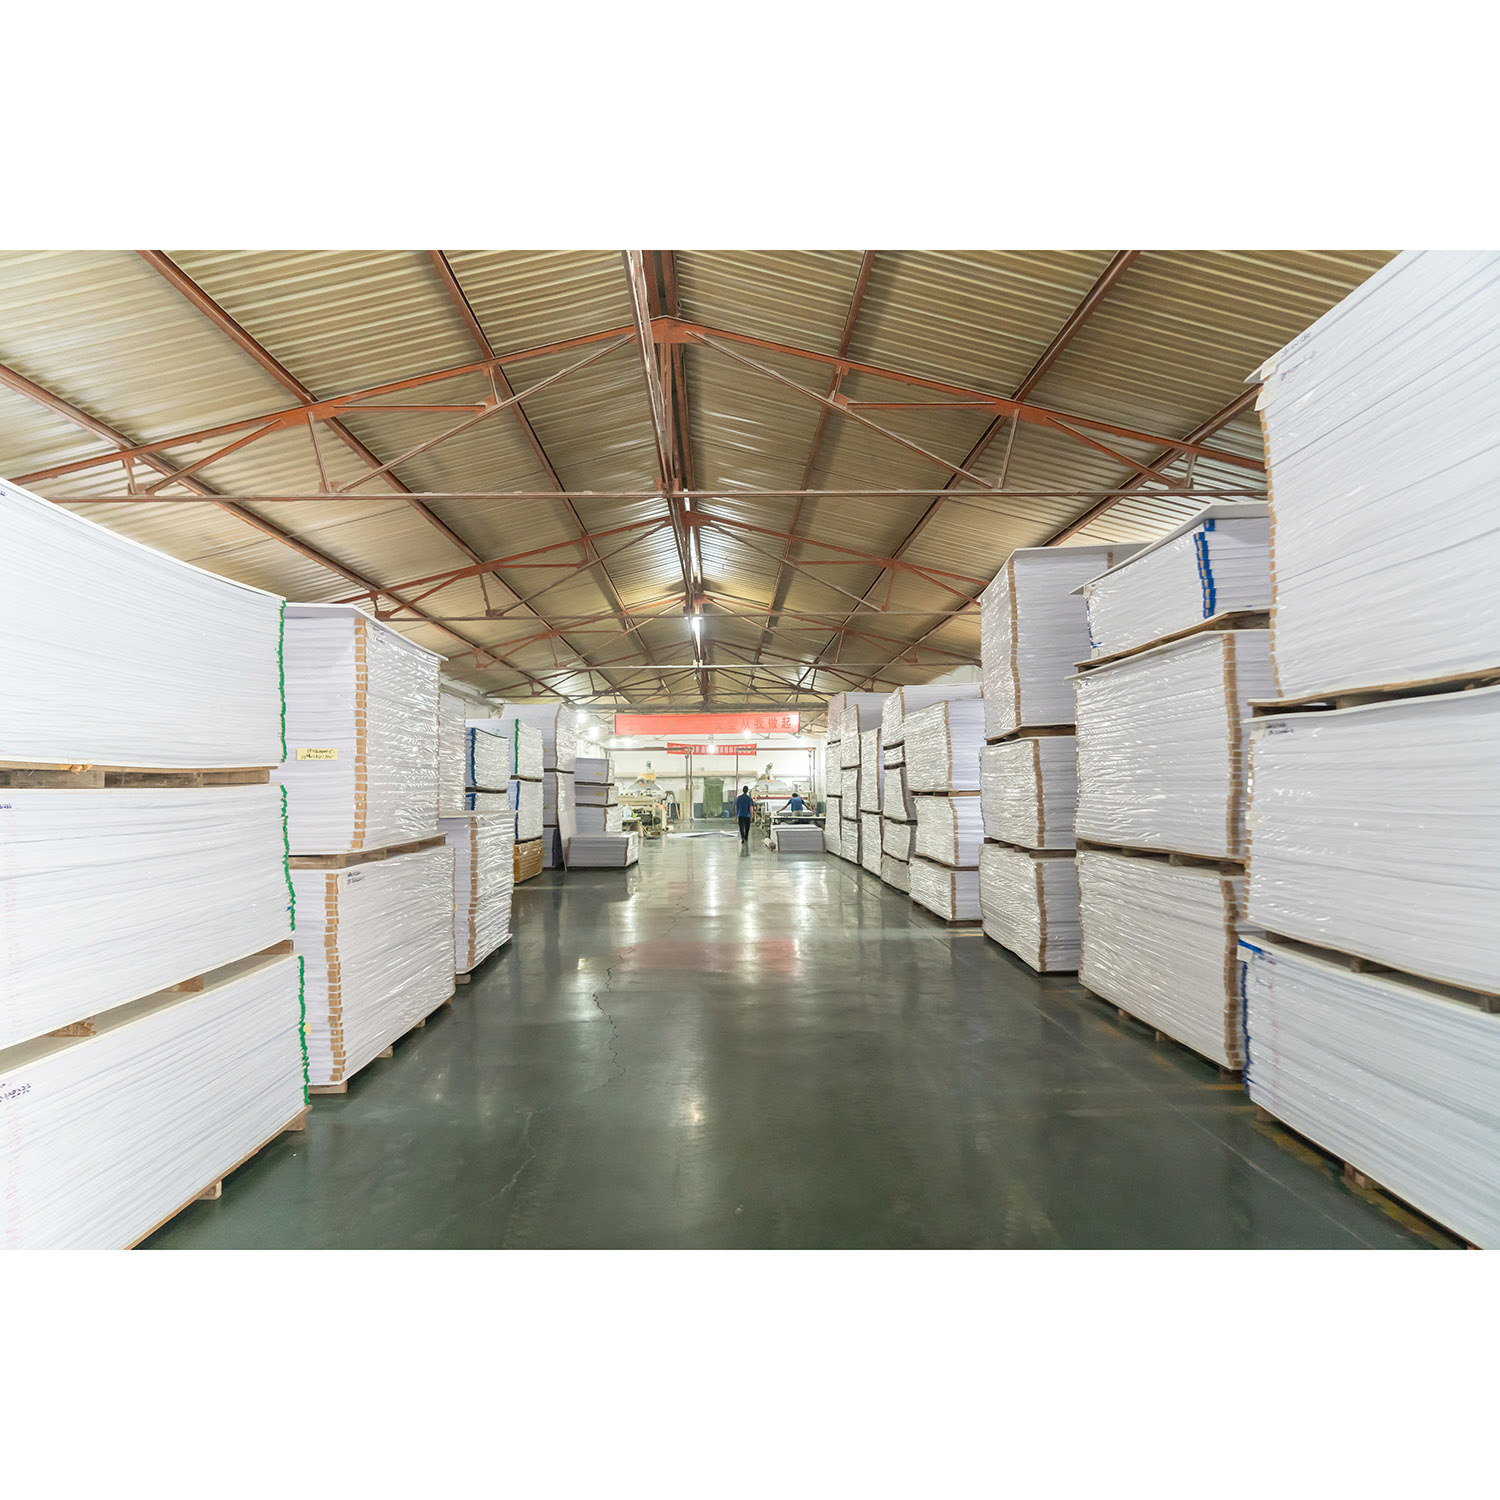
Sheet format drives both container utilisation and cutting yield, which is why format belongs in the row and yield belongs in the cost formula.
Construction, transport and industrial use. DINGTIAN's product page also lists construction, vehicle and ship upholstery, and general industrial manufacture. In these applications the compliance columns dominate: an unclassified fire response is a project risk regardless of mechanical performance, and buyers should request the classification and the underlying report rather than accepting the adjective. Weather resistance and lead-free declarations follow the same rule — a statement should name the standard it is measured against.
What the Market Data Suggests About Comparability
A USD 2.28 billion market growing at a 4.99% CAGR implies capacity expansion, more exporting suppliers and more quote sheets crossing a buyer's desk — but not necessarily more comparability. The structural signal is in the application mix: with signage holding roughly 35% of demand, the largest single buying group is also the one most sensitive to surface quality and colour consistency, which are precisely the properties least standardised in published datasheets.
The practical consequence is that documentation quality becomes a competitive variable. Suppliers that publish test methods, tolerances and certificate scopes will be easier to score, and easier to score usually means easier to shortlist. For buyers, the reverse holds: a matrix built now becomes an asset that shortens every subsequent sourcing cycle, because the column structure survives even when the suppliers change.
Matrix vs. Traditional Sourcing: What It Improves and What It Cannot Do
The traditional approach — request three quotes, order samples, negotiate on unit price, place the order — is fast and works when products are genuinely identical. It breaks down when products differ in construction, when compliance documentation is uneven, and when the cheapest quote is only cheapest at the sheet level. A matrix improves on this by forcing unit, scope and evidence alignment before any negotiation begins.
It also improves on the alternative of accepting a supplier's own comparison table. A supplier-built table is organised around the supplier's portfolio; a buyer-built matrix is organised around the buyer's failure modes. The two rarely produce the same ranking, and the buyer's version is the one that has to survive an inspection.
The limits are real and worth stating plainly. A matrix ranks; it does not verify. A low score is not proof of a poor product — it may only mean the supplier published less. Second, the weighting decides the outcome: two buyers using identical data can reach different rankings, which is why weights must be fixed and recorded before scoring. Third, no matrix replaces physical sample testing, third-party inspection or a factory audit. Fourth, a published range such as 0.32–1.0 g/cm³ spans several grades and, without a stated method and tolerance, functions as an inquiry prompt rather than a specification. Used as a screening and documentation tool and not as a substitute for testing, the framework is dependable; used as a proxy for qualification, it is not.
Future Outlook
Three developments are likely to shape how these matrices are built over the next few years. Compliance documentation will move from a differentiator to an entry requirement, particularly for construction and transport applications where a classification document is expected before a board is approved. Format and process diversity — co-extruded and laminated constructions in particular — will push buyers toward process-specific rows rather than one generic row per supplier. And as capacity in exporting clusters grows, continuity columns will carry more weight than they do today, because the risk in a mature category shifts from finding a board to finding a board that is still the same board in three years.
None of this requires a sophisticated tool. A structured spreadsheet, a documented weighting, a source column and a review date will outperform a more elaborate model built on unverified entries. The discipline is in the columns, not the software.
FAQ
What columns should a PVC foam board comparison matrix contain?
At minimum, four families: identity (process type, grade and density band, thickness, sheet format, colour and finish), physical properties (density with test method, thickness tolerance, weight per sheet, water absorption, dimensional stability), compliance (fire classification, emission position, RoHS/REACH status, certificate number, issuing body and validity), and commercial plus continuity terms (MOQ basis, price basis, landed cost per usable square metre, lead-time definition, monthly capacity, payment terms and inspection rights).
How do I compare density values when suppliers state different ranges?
Do not average them. Compare only when the test method, tolerance, product construction and thickness are aligned, and treat a published range as an inquiry prompt rather than a specification. A free foam board at 0.4–0.6 g/cm³ and a Celuka board at 0.55–0.8 g/cm³ are different constructions serving different applications, so the correct action is to request the grade-specific datasheet for the exact SKU being quoted.
Should price be a column in the matrix or handled separately?
Price belongs in the matrix, but as landed cost per usable square metre rather than as unit price per sheet. The calculation is sheet price plus freight, duty, inspection cost and damage allowance, divided by sheet area multiplied by cutting yield. Duty lookup uses the classification for cellular plates of vinyl chloride polymers, HS 39211200. Keeping price in a separate negotiation file usually hides the yield effect that reverses the ranking.
How should certifications be weighted against physical properties?
Weighting should follow the failure modes of the application. Signage typically weights physical print performance and colour consistency heavily, while construction and transport weight compliance heavily because an unclassified board can stop a project at inspection. In all cases, score the evidence class separately from the value: a traceable test report, a certificate with scope and validity, a published datasheet and a verbal assertion are four different levels of support and should not occupy the same cell.
How often should the matrix be updated for a long-term supplier relationship?
A practical cadence is an annual full re-score, plus event-driven updates when a grade changes, a new destination market adds a compliance requirement, a supplier reports a capacity change, or published terms such as MOQ and lead time are revised. Because published terms can differ between a product page and procurement documentation, each entry should carry its source and date so that updates replace data rather than accumulate contradictions.
Reference document: DINGTIAN corporate brochure — download PDF. Company-reported specifications should be verified against grade-specific datasheets and test reports before procurement.
¿Tiene preguntas o necesita más detalles?
Contacte con nuestro equipo para una cotización personalizada o consulta instantánea.
Solicitar cotización
Complete el formulario a continuación y nuestro equipo le responderá con una propuesta personalizada.
Chat directo de WhatsApp
¿Prefiere chatear en tiempo real? Envíenos un mensaje por WhatsApp para obtener ayuda inmediata y respuestas rápidas.
- Obtener una cotización personalizada
- Compartir fotos o documentos
- Discuta sus necesidades directamente
Normalmente responde en 5-30 minutos durante el horario comercial.