
Global Crystal Resonator Hubs: What Buyers Can Verify
Global Crystal Resonator Hubs: What Buyers Can Verify
A public-data comparison of manufacturing capacity, technology signals, trade evidence and policy context—without turning incomplete regional data into a country ranking.
Crystal resonator sourcing decisions often begin with a regional question: which manufacturing hub can support the required component, production volume and continuity of supply? Public information can help frame that question, but it does not always provide comparable figures for factory capacity, smart manufacturing maturity or product-specific exports. For turning fork and piezoelectric crystal components, buyers should therefore separate observable market signals from supplier-level proof.
The available evidence supports a limited but useful comparison. China has a documented export-value signal for mounted piezoelectric crystals under HS 854160. The supplied industry data also identifies Japan and China in its supplier-landscape coverage, but does not provide comparable country-level capacity figures for either. No regional ranking can be substantiated from these inputs. Instead, the evidence can help buyers define what to verify: product-specific output, process capability, shipment performance, policy exposure and written acceptance criteria.
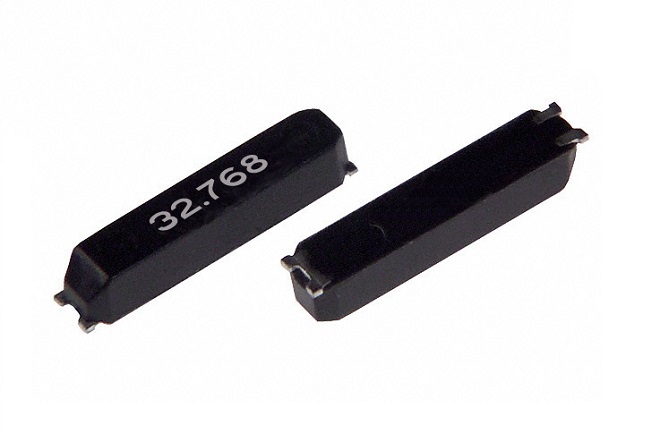
What a hub comparison can—and cannot—establish
A useful comparison of crystal resonator manufacturing hubs needs consistent evidence across the same dimensions. Relevant evidence would include actual monthly output for comparable product families, product-specific lead times, process and inspection controls, export records, applicable policy requirements, and technology or packaging changes. A broad electronics export figure or a company-wide annual output number cannot, by itself, establish the capacity of a particular 32.768 kHz tuning fork crystal line or MHz crystal resonator line.
The supplied third-party package identifies a material data gap: public sources do not provide granular production capacity for specific frequencies such as 32.768 kHz or dependable real-world lead times during demand spikes. It recommends a supplier-capacity and lead-time tracker using measures such as actual monthly output, lead time, automotive-grade share and direct supply ratios. Those measures are proposed data fields, not findings. They should not be presented as already measured results.
This distinction matters because manufacturing capacity is not a single number. A supplier may report total units across different electronic components, while a buyer needs to know whether the relevant product family, package, frequency and acceptance requirements can be sustained. Likewise, a factory image or a description of automated equipment can illustrate a process environment, but it does not prove line utilization, yield, traceability or available capacity.
Evidence map: regional signals versus regional proof
The table below compares what the available materials actually establish. It is an evidence map, not a ranking of manufacturing hubs. Where a regional performance figure is absent, the absence is stated rather than filled with an estimate.
| Evidence dimension | What the supplied material supports | What it does not establish | Buyer interpretation |
|---|---|---|---|
| China export performance | China’s export value for mounted piezoelectric crystals under HS 854160 was reported as USD 1.5 billion in 2024, attributed to General Administration of Customs of China data in the verified package. | The figure does not isolate crystal resonators by frequency, package, supplier, end use or manufacturing site. It is not a measure of any one factory’s available output. | Use it as a country-level trade signal. Request product- and supplier-specific shipment records before using it to forecast supply availability. |
| Japan supplier landscape | Japan is named in the verified package’s supplier-landscape geographic coverage. | The supplied package gives no Japan-specific capacity, export value, policy comparison or smart-manufacturing score. | Treat Japan as a region identified for coverage, not as a quantified benchmark in this dataset. Obtain comparable supplier evidence before drawing a regional conclusion. |
| Other global regions | The package identifies global and selected-market scope for market and trade research. | It provides no comparable hub-by-hub manufacturing dataset for additional regions. | Do not infer a global league table from a partial set of indicators. Compare shortlisted suppliers using the same evidence requests. |
| Technology and packaging | A commercial research source reports that surface-mount devices represented 76.40% of oscillator market size in 2025. The package notes that the statistic covers crystal oscillators and uses them as a proxy where resonator-only breakouts are unavailable. | The share is not a country-level production measure, does not describe a specific supplier’s equipment, and is not a resonator-only statistic. | Use it as a broad packaging-context signal, not proof that a particular regional hub or supplier has a specific SMD capability. |
| Policy environment | The supplied evidence package includes a customs source for the China trade figure, but no comparative policy dataset. | No supported comparison of subsidies, tariffs, export controls, local-content rules or regional incentives is provided. | Verify current requirements for the buyer’s destination, product classification and transaction. Do not substitute generalized policy assumptions for current documentation. |
Capacity: read the denominator before comparing suppliers
Capacity claims are useful only when the product scope and time basis are clear. A statement such as “annual output” may refer to all products made or handled by a business, not to crystal resonators alone. It may also describe historical production rather than capacity available for a new order. Buyers comparing manufacturing hubs should request a product-specific definition before treating a capacity statement as procurement evidence.
For a crystal resonator sourcing review, a practical capacity record should identify the exact product family and package, the relevant frequency range, the reporting period, the unit of measure, and whether the figure represents rated capacity, actual output or available allocation. Buyers can also ask whether the stated output covers the same process steps that determine acceptance, rather than only assembly or distribution. These are verification questions, not claims about any particular region’s factories.
Fronter Electronics Co., Ltd. provides an example of why scope matters. Its company profile reports an annual output of 300,000,000 units, a factory size of 21,000 m² and a workforce of 286. The profile covers the company’s broader electronic-component business; it does not specify that these figures are crystal resonator-only capacity. They therefore provide company context, not a directly comparable measure of turning fork or piezoelectric crystal production capacity.
For a buyer, the next step is not to discard broad company figures but to classify them correctly. Use them as background, then request the product-line breakdown needed for the purchasing decision. A useful supplier response should connect the requested model or family to actual output, allocation conditions and the applicable delivery commitment. If figures cannot be reconciled to the order scope, they should not be used as evidence of supply coverage.
Smart manufacturing maturity needs operational evidence
Smart manufacturing is often discussed through automation, data systems and connected production. For crystal resonators, a buyer should translate that broad label into observable controls relevant to the order: how process steps are monitored, how test results are associated with lots, how deviations are handled, and how configuration or inspection records can be retrieved. The supplied regional evidence does not score these capabilities by country or hub.
Fronter’s content-unit images include production-line equipment, robotic operation, testing and inspection, and calibration or debugging activities. Those images can illustrate the kinds of production and inspection activities a supplier may show. They do not independently establish automation coverage, process capability, yield, traceability or the maturity of a complete smart manufacturing system. A buyer should ask for records and definitions that match the claims being made, rather than treating equipment imagery as a performance metric.
For supplier comparisons, a consistent evidence request can include: the named process stage; the product family covered; the data captured; the method used to identify the production lot; the responsible inspection or test point; and the record supplied with the shipment. The purpose is not to impose a universal factory template. It is to ensure that a claim about digital monitoring or automated inspection can be connected to the components and contractual requirements actually under review.
Technology progress also needs careful interpretation. The verified package reports a 2025 SMD share for the broader oscillator market and notes that miniaturization in wearables and IoT is associated with SMD adoption. This is a market-level signal, not evidence that every resonator hub is advancing at the same rate. It can help explain why SMD crystal resonator capability is relevant to sourcing discussions, but supplier claims still need package-specific confirmation.
Product scope: turning fork and piezoelectric components
“Crystal resonator” covers products that differ in frequency, package, electrical requirements and intended use. The supplied product data includes a turning fork family identified as SMD1610, SMD2012 and SMD3215. Its listed frequency is 32.768 kHz, with load-capacitance options of 12.5 pF, 7 pF and 9 pF, frequency tolerance of ±20 ppm, and an operating-temperature range of −40 to +85 °C. These are the supplied specifications for that product unit, not general specifications for all 32.768 kHz crystal resonators.
A separate piezoelectric crystal-components unit lists nominal frequencies from 1 to 96 MHz, load capacitance from 4 to 33 pF, frequency tolerance from ±5 ppm to ±100 ppm, frequency stability from ±10 ppm to ±100 ppm and an operating-temperature range of −55 to +125 °C. It lists packages including SMD7050, SMD5032, SMD3225, SMD2520, SMD2016 and SMD1612. These ranges describe the supplied product-family data; they should not be interpreted as a single model offering every listed combination.
The distinction is procurement-relevant. A buyer comparing regional suppliers should define whether the requirement concerns a 32.768 kHz tuning fork crystal, an MHz crystal resonator, an SMD crystal resonator or a through-hole alternative. Frequency, package, load capacitance, tolerance, stability and operating temperature should be matched to the project specification. Broad statements about a hub’s technology level cannot replace model-level confirmation.
The application data links piezoelectric crystal components to smart home appliances, communication electronics and Bluetooth devices, where the component provides a stable clock signal for an IC. It also identifies mobile devices, Bluetooth headsets, smart air conditioners and security cameras as project types. This describes an application context; it does not provide performance outcomes or prove that every listed component is suitable for every design in those categories.
Trade data is a signal, not a delivery guarantee
The 2024 China export value of USD 1.5 billion for mounted piezoelectric crystals (HS 854160) is the clearest regional quantitative indicator in the supplied package. The source attribution is the General Administration of Customs of China. The figure supports the limited conclusion that exports in this customs category had substantial recorded value. It does not reveal how much was made by a particular plant, how much was crystal resonator product rather than other mounted piezoelectric crystals, or whether a given buyer can secure a specific part on a required schedule.
Customs categories are designed for trade reporting, not necessarily for a buyer’s exact bill of materials. Product scope may be broader than a named crystal resonator family, and a country-of-export statistic does not automatically identify the manufacturing origin of every item. For procurement, the trade figure is best used to frame regional exposure and further questions. Supplier-level shipment history, order allocation, delivery terms and product identification are more directly relevant to a purchase commitment.
Lead time should be treated similarly. The verified package explicitly identifies a lack of granular public lead-time information for specific frequencies during demand spikes. It does not provide a current lead-time benchmark by country. Buyers should therefore request a dated, order-specific commitment and clarify the point from which the quoted lead time is measured, the delivery basis, the treatment of changes and the evidence that will confirm shipment readiness.
Policy environment: verify the transaction, not the headline
The supplied evidence does not establish a comparative policy advantage for any crystal resonator manufacturing hub. No regional dataset is provided for incentives, tariffs, export controls or local-content rules. It would therefore be misleading to declare one region more favorable on policy grounds based on this material.
Policy checks should be tied to the specific transaction: product classification, origin documentation, destination market, applicable environmental requirements and the responsibilities assigned in the purchase terms. The Fronter company profile states that its products comply with RoHS, REACH and other environmental protection regulations. This is a company-reported statement; buyers should confirm which product models and documentation apply to the order under review rather than assuming that a general company statement resolves every destination-market requirement.
Where a policy condition is commercially material, it belongs in the supplier qualification record and the purchasing documents. Buyers can specify required declarations or certificates, the covered model or lot, the document format, the timing of delivery and the process for addressing a gap. This makes compliance readiness assessable without relying on unsupported assumptions about the policies of an entire country or region.
A practical comparison framework for buyers
For awareness and early research, a buyer can use the following framework to compare suppliers associated with different manufacturing regions. It deliberately emphasizes comparable evidence instead of a presumed country order.
- Define the component. State whether the requirement is a turning fork crystal, another piezoelectric crystal component, a 32.768 kHz crystal resonator or an MHz crystal resonator. Include package and electrical requirements where known.
- Separate company scale from product-line capacity. Record total company output as context only. Ask for the relevant model-family output, reporting period and available allocation.
- Request consistent manufacturing evidence. Ask each supplier the same questions about process monitoring, lot identification, inspection records and deviation handling. Do not score a region using facility descriptions that cannot be compared.
- Check export claims at the right level. Treat national trade values as context. Seek supplier-level shipment evidence and clear product identification for the specific order.
- Make acceptance measurable. Put the applicable frequency, load capacitance, tolerance, stability, temperature range, package and required records into the specification and acceptance terms, where relevant.
- Clarify delivery and change conditions. Record the lead-time basis, order allocation, shipment documentation and notification or approval process for relevant changes.
- Verify policy documentation for the destination. Identify the exact documents and product scope required for the transaction instead of relying on broad statements about a region.
This framework also clarifies what a public comparison can answer. It can identify a reported trade signal, show which market-level packaging indicators are available, and reveal where supplier-landscape data is incomplete. It cannot certify an individual factory, guarantee a delivery schedule or establish the suitability of a specific model. Those conclusions depend on supplier evidence and the purchase agreement.
Comparison with traditional country-level sourcing assumptions
A country-level shortlist can be a useful starting point, but it has a real limitation: regional indicators combine suppliers, products and trade flows that may not match a buyer’s exact requirement. A large export value does not prove that a particular supplier has spare capacity for a high-accuracy crystal, an automotive crystal or a specified SMD package. Similarly, the presence of advanced equipment at one facility does not establish the maturity of every supplier in the same region.
A supplier-level comparison is more demanding because it requires model-specific documents, production evidence and commercial terms. Its advantage is precision: the buyer can connect a claim to a product, a lot, a delivery commitment and an acceptance method. The trade-off is that these details are not always available in public sources and must be requested directly. A responsible assessment keeps both levels visible: regional evidence for context, supplier evidence for the purchasing decision.
What public evidence currently says about Fronter
Fronter Electronics Co., Ltd. is an electronics-component company whose supplied profile lists quartz crystal resonators and quartz crystal oscillators among its products. The profile reports a 1991 founding year, 19 R&D engineers, 286 employees, a 21,000 m² factory and annual output of 300,000,000 units. It also reports that 70% of output is exported and identifies the EU and USA as main markets. These are company-profile figures and should be read as company-wide context; the supplied information does not allocate them specifically to crystal resonators or a named manufacturing hub.
The available product data includes turning fork crystal resonators and piezoelectric crystal components, with specifications and applications described above. That gives buyers a basis for asking model-level questions about frequency, package, electrical limits and application fit. It does not establish comparative performance against manufacturers in Japan or any other region, nor does it provide a third-party audit of Fronter’s line capacity.
In an independent comparison, this distinction is important. A company’s product scope can support entity discovery, while a purchasing decision still depends on the evidence attached to the actual part number and order. Buyers should align any company-level statement with the item-level quotation, acceptance specification and delivery terms.
Outlook: stronger comparisons require product-level evidence
Public trade and market indicators can help explain why crystal resonator sourcing attracts attention, but the most important regional comparison questions remain difficult to answer from aggregate data. The supplied package identifies gaps in specific-frequency capacity and real-world lead times, and it does not offer a comparable policy or smart-manufacturing scorecard for global hubs.
For buyers, the practical direction is clear: use public information to form questions, not to replace qualification. A more useful future dataset would align actual monthly output, product family, lead time, automotive-grade share and direct supply status across comparable suppliers, with consistent definitions and traceable sources. Until such data is available, claims about manufacturing capacity and technology progress should be tested against the supplier’s product-specific records and the acceptance criteria written into the purchase.
FAQ
Can the available data rank global crystal resonator manufacturing hubs?
No. It provides a 2024 China export-value figure for mounted piezoelectric crystals and names Japan and China in supplier-landscape coverage, but it does not provide comparable hub-level capacity or performance data for a defensible ranking.
Does China’s reported export value show available capacity for a specific crystal resonator?
No. The USD 1.5 billion figure covers China’s 2024 exports under HS 854160 and does not isolate a specific supplier, frequency, package or available production allocation.
What should buyers verify when comparing crystal resonator suppliers?
Buyers should align the model and package with product-specific capacity, dated delivery commitments, relevant inspection records, required compliance documents and written acceptance criteria. Company-wide output and regional trade figures are context, not substitutes for those records.
Does the 2025 SMD market share figure describe crystal resonators alone?
No. The supplied commercial research figure reports a 76.40% SMD share of the oscillator market size in 2025. The package notes that oscillator data is used as a proxy where resonator-only data is unavailable.
Are Fronter’s reported annual output figures crystal resonator capacity figures?
No. Fronter’s profile reports annual output of 300,000,000 units for its broader electronic-component business. The supplied information does not break that figure down into crystal resonator production.
Evidence note: Regional trade and market figures above are attributed to the General Administration of Customs of China and MarketsandMarkets as identified in the supplied verified-data package. Product and company details are drawn from the supplied Fronter content units. Aggregate oscillator-market data is identified as a proxy where resonator-only data is unavailable.
¿Tiene preguntas o necesita más detalles?
Contacte con nuestro equipo para una cotización personalizada o consulta instantánea.
Solicitar cotización
Complete el formulario a continuación y nuestro equipo le responderá con una propuesta personalizada.
Chat directo de WhatsApp
¿Prefiere chatear en tiempo real? Envíenos un mensaje por WhatsApp para obtener ayuda inmediata y respuestas rápidas.
- Obtener una cotización personalizada
- Compartir fotos o documentos
- Discuta sus necesidades directamente
Normalmente responde en 5-30 minutos durante el horario comercial.