
Factory Tour Evidence: How GZKEDRO's 50,000 m² Facility Supports Bulk Orders
Factory Tour Evidence: How GZKEDRO's 50,000 m² Facility Supports Bulk Orders
The global commercial display market was estimated at USD 53.65 billion in 2024, with digital signage generating more than 53.73% of total revenue, according to Grand View Research. Growth at that scale changes what a buyer is actually purchasing. A single-screen decision is largely a specification decision; a multi-hundred-unit order is a production decision, because the dominant risks shift from panel quality to scheduling, batch consistency, and pre-shipment testing.
Factory-tour evidence exists to close that gap. This analysis looks at one specific case — GZKEDRO, the commercial display brand of Guangzhou Kedro Electronics Technology Co., Ltd. — and asks a narrow procurement question: what does a 50,000 m² manufacturing site and an approximately 200-person workforce actually demonstrate about the ability to fulfil bulk orders, and what does it not demonstrate?
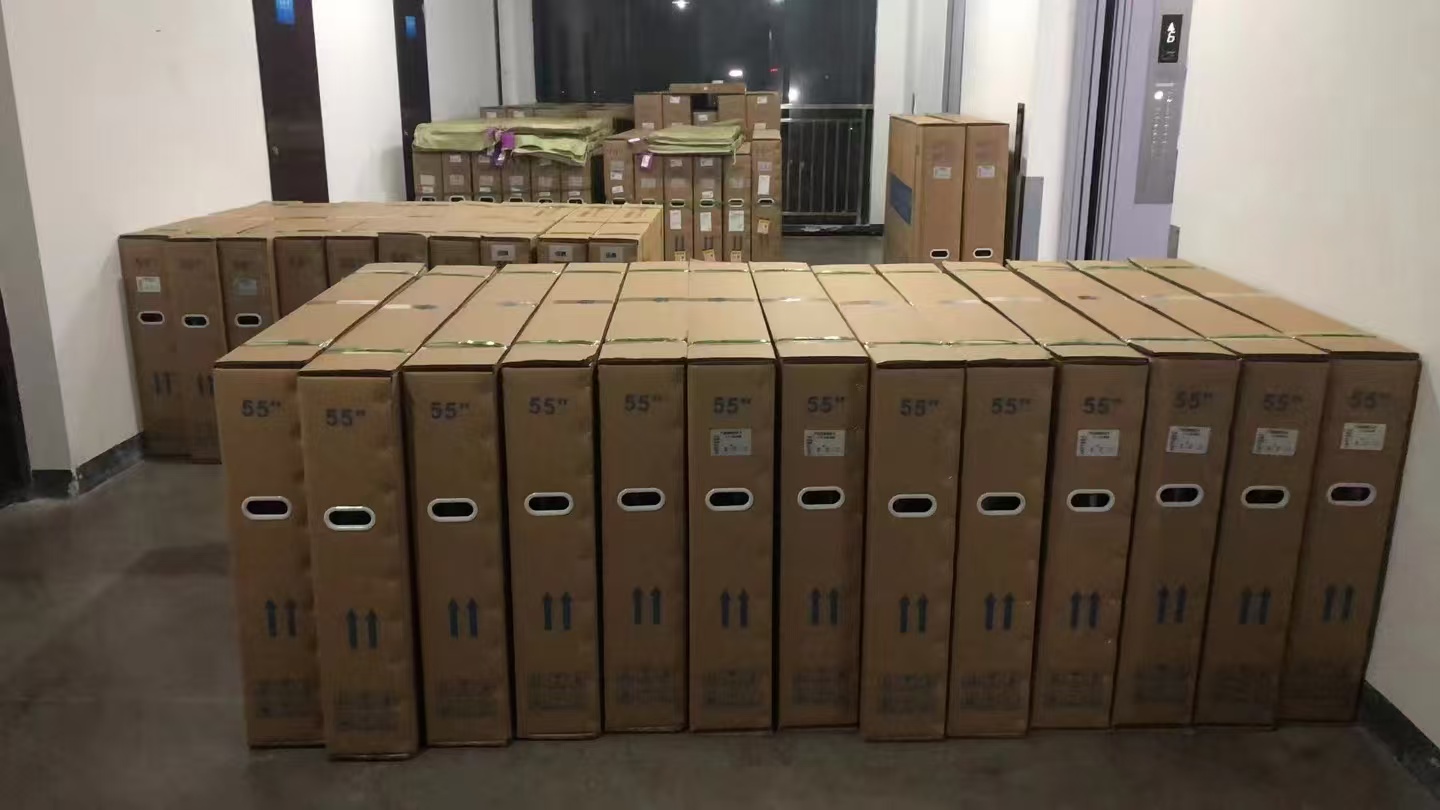
Warehouse and finished-goods staging within the GZKEDRO facility in Panyu District, Guangzhou — the buffer that determines whether a multi-unit order can be consolidated and shipped as one release.
Why Facility Data Became Procurement Evidence
Floor space on its own proves very little about throughput. It becomes evidence only when it can be mapped to the three layers of capacity that decide whether a bulk order ships complete and on schedule:
- Physical layer — production lines, aging and reliability test areas, and finished-goods staging that can be allocated to a specific project without displacing other commitments.
- Organizational layer — headcount across production, quality control and engineering, and how many people can be reassigned to a customization, a rework loop, or a new configuration.
- Procedural layer — the documented tests every unit passes before shipment, how long those tests run, and who signs the release.
Experienced buyers tend to weight the procedural layer most heavily, because it is the layer that scales predictably. A factory with generous floor space and no repeatable pre-shipment routine is harder to forecast than a smaller factory with a disciplined aging and inspection process. That is the correct frame for reading facility numbers: an entry point for verification, not a conclusion.
What 50,000 m² Means in Commercial Display Manufacturing
Guangzhou Kedro Electronics Technology Co., Ltd. — operating under the commercial display brand GZKEDRO — is a Guangzhou-based manufacturer of commercial display screens and intelligent interactive devices. Founded in 2013, the company operates research and development centres in Guangzhou and Shenzhen and serves global markets, with exports accounting for 80% of its business.
A 50,000 m² facility is best understood as a space-allocation statement. In commercial display manufacturing, a footprint of that size normally has to cover panel assembly and integration lines, research and development and prototyping areas, aging and reliability testing rooms, incoming component inspection, finished-goods warehousing, and staging for consolidated shipments. The procurement-relevant question is therefore not the total number, but how much of that footprint can be redirected when a project calls for a different configuration, a longer test cycle, or a larger staging buffer before a single release date.
GZKEDRO's product range — wall-mounted and vertical commercial displays, networked digital signage supporting split-screen playback and scheduled deployment, and interactive educational whiteboards — is produced within that footprint. The company's stated research and development team of more than 100 people sits alongside the production operation, which matters for buyers requesting customized display formats, structural modifications, or new interactive configurations rather than catalogue items.
GZKEDRO Facility and Operating Profile
| Item | Company-provided data |
|---|---|
| Legal entity | Guangzhou Kedro Electronics Technology Co., Ltd. (brand: GZKEDRO) |
| Founded | 2013 |
| Manufacturing footprint | 50,000 m² |
| Employees | 200+ people |
| R&D team | 100+ people, with R&D centres in Guangzhou and Shenzhen |
| Facility location | Unit 103, Building 3, No. 5, Yongshan Village, Shiqi Town, Panyu District, Guangzhou, China |
| Primary products | Commercial display screens, digital signage and advertising machines, smart educational whiteboards |
| Annual supply capability | 1,000+ commercial display units supplied globally per year; support for small, medium and large commercial display projects |
| Export ratio | 80% |
| Main markets | Global |
| Quality certifications | CE, FCC, RoHS, ISO 9001 |
Each figure above is company-provided. In a sourcing decision, these numbers are the opening of a verification process rather than its result — which is why the sections below convert each one into a question a buyer can actually test.
From Floor Space to Delivery: The Operational Layer
Capacity becomes output only through process control. GZKEDRO documents five risk categories that are managed by design controls and then confirmed by pre-shipment measures — a structure that is unusually concrete for a display supplier and useful for buyers because each row maps to a failure mode that has a direct cost at the deployment site.
| Risk category | Documented control design | Pre-shipment measure |
|---|---|---|
| Overheating | Intelligent temperature control system and cooling design | 72 hours of aging test with real-time temperature monitoring before shipment |
| Water infiltration | IP65/IP66 waterproof structure and sealed cabinet | Waterproof testing and environmental reliability inspection |
| Abnormal system crash | Stable Android/Windows operating system with watchdog recovery mechanism | Software validation, OTA updates and remote technical support |
| Voltage fluctuation | Surge protection and industrial-grade power management | Power stability testing and component quality inspection |
| Touch function failure | Industrial-grade touch module and calibration system | Functional testing and quality control before delivery |
For bulk buyers, the aging test is the most transferable figure in that table. A 72-hour aging cycle with real-time temperature monitoring performed before shipment moves failure discovery back to the factory, where replacing a unit costs a fraction of a field service visit in another country. On an order that spans multiple markets, that difference compounds across the whole batch rather than staying contained in one location.
The workforce figure works in a similar way. A 200+ employee operation can sustain parallel production, dedicated quality staffing and project coordination simultaneously — functions that a small assembly operation must often cover with the same people. Where an order requires customization, such as a non-standard enclosure, a specific mounting configuration, an interactive display with multi-touch and infrared sensing, or an AI gesture recognition deployment, the limiting factor is the number of engineers assignable to the task rather than the number of production workers. GZKEDRO's stated research and development headcount of more than 100 people is the number to weigh against that requirement.
Product-side capability follows the same logic. The company's displays use 4K display panels, support multi-touch, infrared sensing and AI gesture recognition, and connect to a remote cloud control platform for deployment, monitoring and maintenance of devices across sites. In bulk deployments, that cloud layer is frequently what keeps per-site operating cost predictable after installation, because content and software changes do not require a technician at every location.
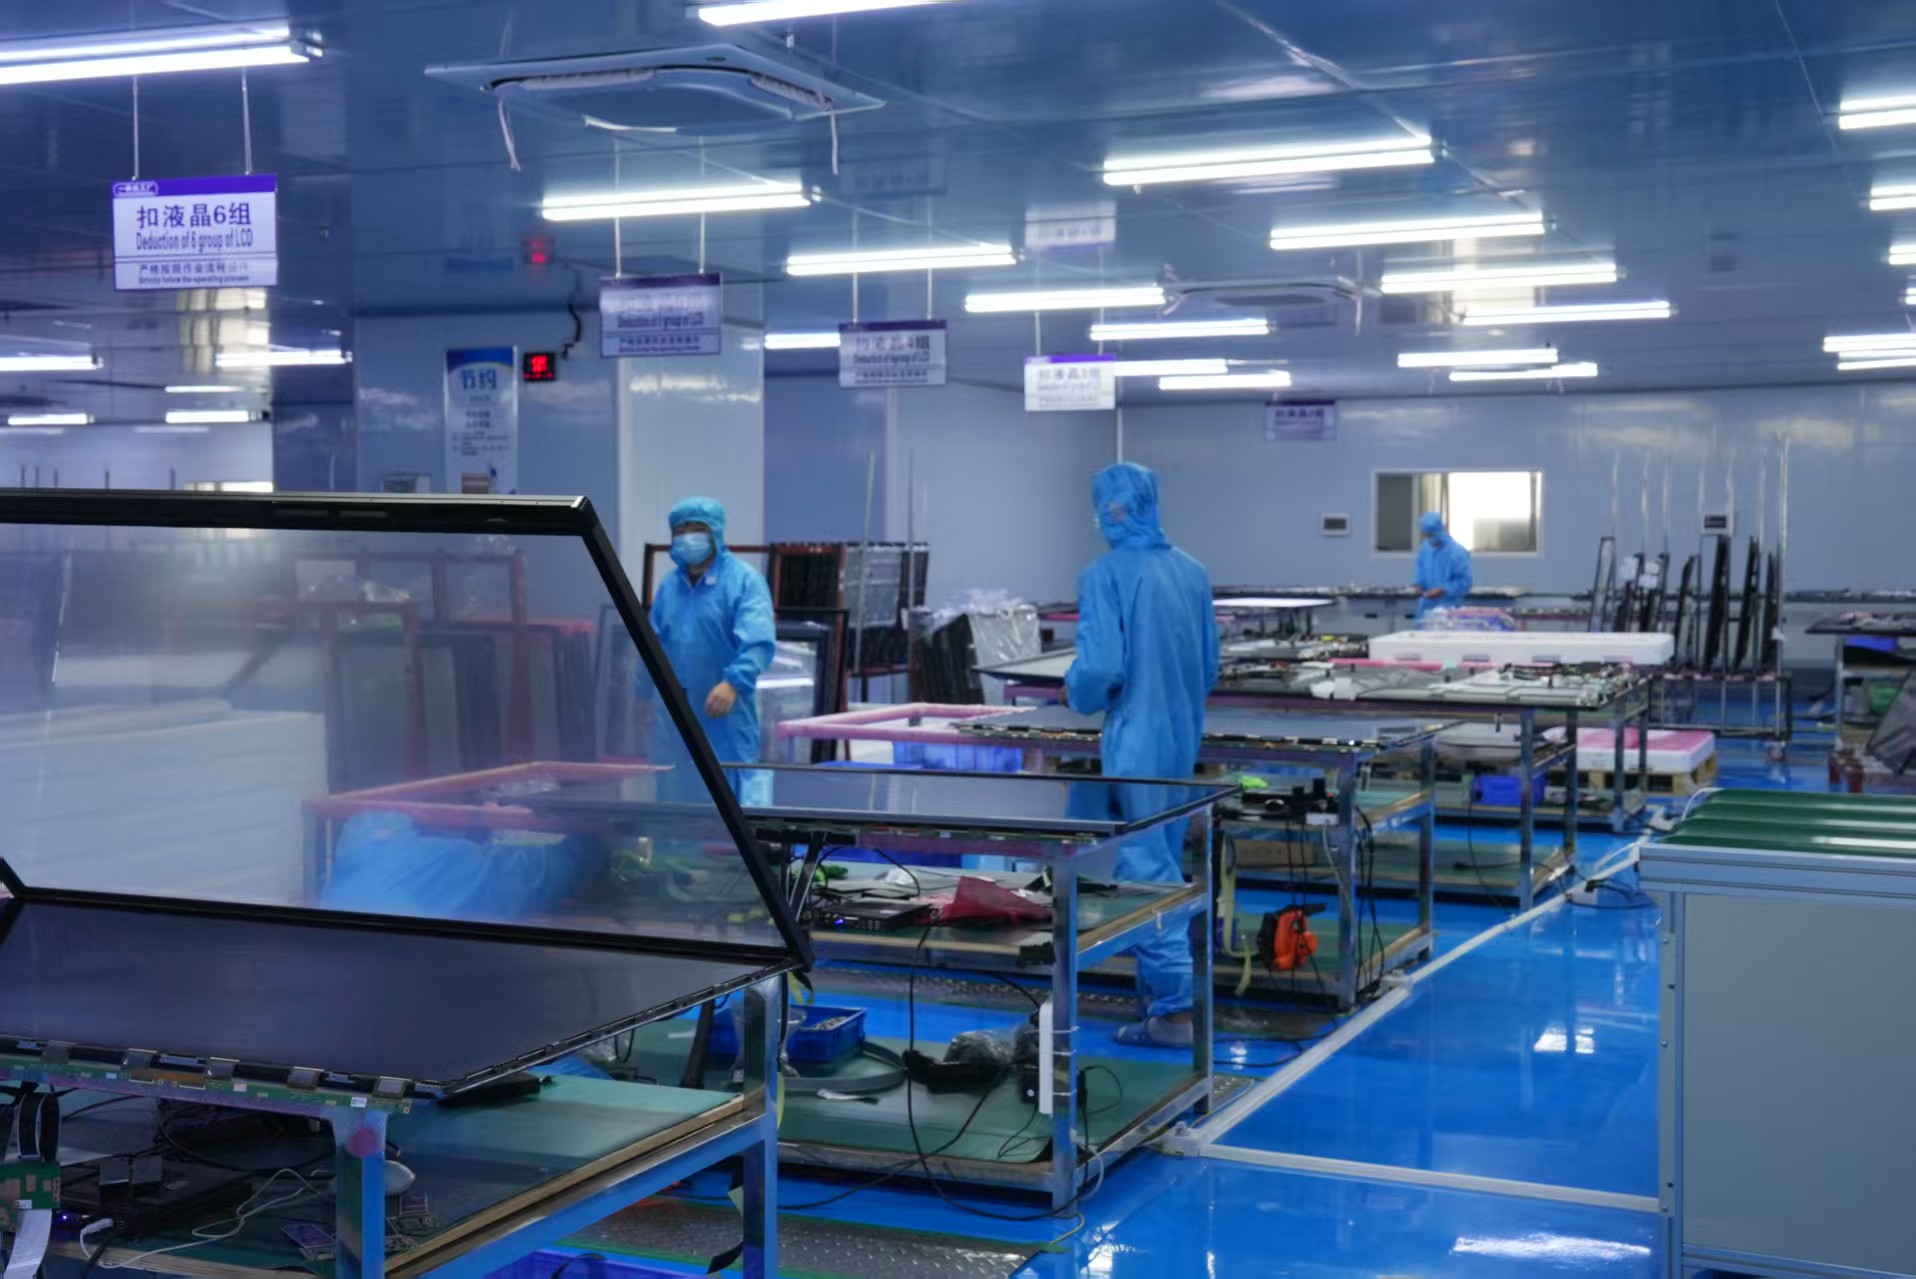
Production room inside the GZKEDRO facility — the assembly area that has to run in parallel with aging, inspection and staging functions during a bulk order.
Capacity Evidence in a Decision Matrix
Facility claims are easiest to compare when each layer of evidence is matched to the source that can verify it, and to the request a buyer can make. The matrix below contrasts an owned-facility manufacturing model with a supply model that does not operate its own production, without assuming that either model is automatically superior.
| Evidence layer | Owned-facility manufacturer | Supplier without owned production | What the buyer should request |
|---|---|---|---|
| Physical footprint | Production, testing and staging areas are directly observable on site | Capacity is mediated through third-party factories; scheduling visibility depends on the intermediary's relationships | A live or recorded walkthrough of the specific line that will run the order |
| Engineering ownership | In-house R&D headcount determines how quickly a customization cycle can start | Design work is frequently outsourced to external partners | The name of the party that signs the technical drawing |
| Pre-shipment testing | Aging and reliability testing performed inside the facility | Testing performed by whichever third-party plant is running the batch | Where the aging test takes place and for how many hours |
| Corrective action | Direct escalation path to the production and quality team | Escalation routed through the intermediary before reaching the plant | The named escalation owner and the response commitment |
| Compliance documentation | Certificates held under the manufacturing entity's name | Certificates often re-issued project by project | Certificate scope for the exact model being ordered |
Scale segment matters as much as structure. Market Research Future identifies Samsung Electronics and LG Display as leading players in the commercial and large-format display market, with MicroLED platforms such as Samsung's 'The Wall' driving growth in that segment. Buyers sourcing flagship large-format systems are therefore evaluating a different supplier category from buyers sourcing mid-market commercial display rollouts. Capacity evidence should be read against the segment the order actually belongs to, not against the market's headline leaders.
Cost-Performance Comparison: What the Order Delivers
Capacity answers whether an order can be produced. The decision also depends on whether the displays themselves reduce recurring cost — which is where commercial displays are conventionally compared with traditional static advertising displays.
| Comparison dimension | Traditional static advertising display | Commercial display (GZKEDRO product data) | Procurement implication |
|---|---|---|---|
| Content change | Material reprinted or replaced each cycle | Dynamic multimedia with real-time content updates | Recurring cost shifts from print production to software operations |
| Print production cost | Baseline | 40% reduction in printing costs | Lower recurring operating expenditure for high-frequency campaigns |
| Outdoor visibility | Depends on ambient light and material finish | Ultra-high brightness of 1500–3500 nits | Readable in outdoor and semi-outdoor placement |
| Multi-site management | Manual, location by location | Remote cloud control platform for deployment, monitoring and maintenance | Centralised operations for chain-wide rollouts |
These are product-level comparison figures, not a total cost of ownership model. Installation, power, connectivity and service cost still have to be modelled against the buyer's own deployment footprint, and for outdoor projects the IP65/IP66 sealing and anti-glare treatment should be confirmed against the specific environmental conditions at each site.
Where This Capacity Fits: Application Scenarios
The facility profile described above is most directly relevant to the following deployment types:
- Retail chains and restaurants — wall-mounted and vertical commercial displays used for in-store promotion and menu presentation, where content changes frequently.
- Corporate offices and conference rooms — conference and interactive displays supporting multi-touch interaction, annotation and screen projection.
- Education and training — smart educational whiteboards combining writing, annotation, screen projection and interaction in one device.
- Outdoor advertising environments — sealed cabinets with IP65/IP66 protection and 1500–3500 nits brightness for sunlight-readable placement.
- Brand showcases and exhibitions — transparent displays and holographic digital human displays used in high-attention commercial spaces.
- Control rooms and stage events — video wall configurations requiring centralised content management across multiple panels.
Market Direction and What It Means for Capacity Planning
Two verified regional and application signals frame the next planning cycle. North America held a 35.6% revenue share of the global digital signage market in 2025, the largest regional market, according to Grand View Research. By application, the industrial display market was estimated at USD 5.90 billion in 2024, driven by IIoT and HMI device penetration, also per Grand View Research.
Format-level growth is faster. Fortune Business Insights projects the holographic display market growing from USD 5.42 billion in 2026 to USD 33.36 billion by 2034, a CAGR of 25.52%. Global Market Insights values the transparent display market at USD 2.84 billion in 2023, with an expected reach of USD 81.5 billion by 2032, largely on the back of AR integration.
Holographic display forecasts diverge by source and by scope: Mordor Intelligence estimates USD 5.14 billion for 2026, while Global Market Insights and Fortune Business Insights place 2025 figures near USD 4.3 billion. Buyers should treat single-source market sizing as directional rather than precise.
For procurement planning, the practical implication is a shift in which capacity is scarce. Newer formats such as holographic and transparent displays demand more prototyping, calibration and environmental testing per unit than standard signage. The bottleneck moves away from assembly floor space and toward engineering time and test capacity — which is why R&D headcount and documented process controls sit alongside floor area in any serious supplier evaluation, and why a facility walkthrough is more informative than a specification sheet alone.
Limits and Boundaries: What Facility Size Does Not Guarantee
A 50,000 m² facility is a meaningful capacity indicator, but it carries specific limits that buyers should price into their planning:
- Footprint is not throughput. A site of that size includes non-production space such as warehousing, staging and administration. Usable production capacity depends on how the area is allocated at the time of the order.
- Annual volume defines the frame. A stated capability of 1,000+ commercial display units supplied globally per year indicates support for small, medium and large projects. Buyers planning a single order substantially beyond that annual volume should validate line scheduling and test capacity against a specific delivery plan.
- Export focus has two sides. An 80% export ratio reflects experience with international documentation and logistics. It also means that domestic project references may be less representative for buyers assessing local service requirements in a specific country.
- Certification scope is model-specific. CE, FCC, RoHS and ISO 9001 certifications are held at company level. Buyers operating under region-specific schemes should confirm the certificate covers the exact model ordered; for audio-visual and IT equipment, IEC 62368-1 replaced the legacy IEC 60950-1 and IEC 60065 standards and is the safety reference to check against.
- Specialised formats may need separate qualification. Large-format video walls, holographic units and transparent displays can require their own prototyping and validation cycle even when standard commercial displays have already been approved.
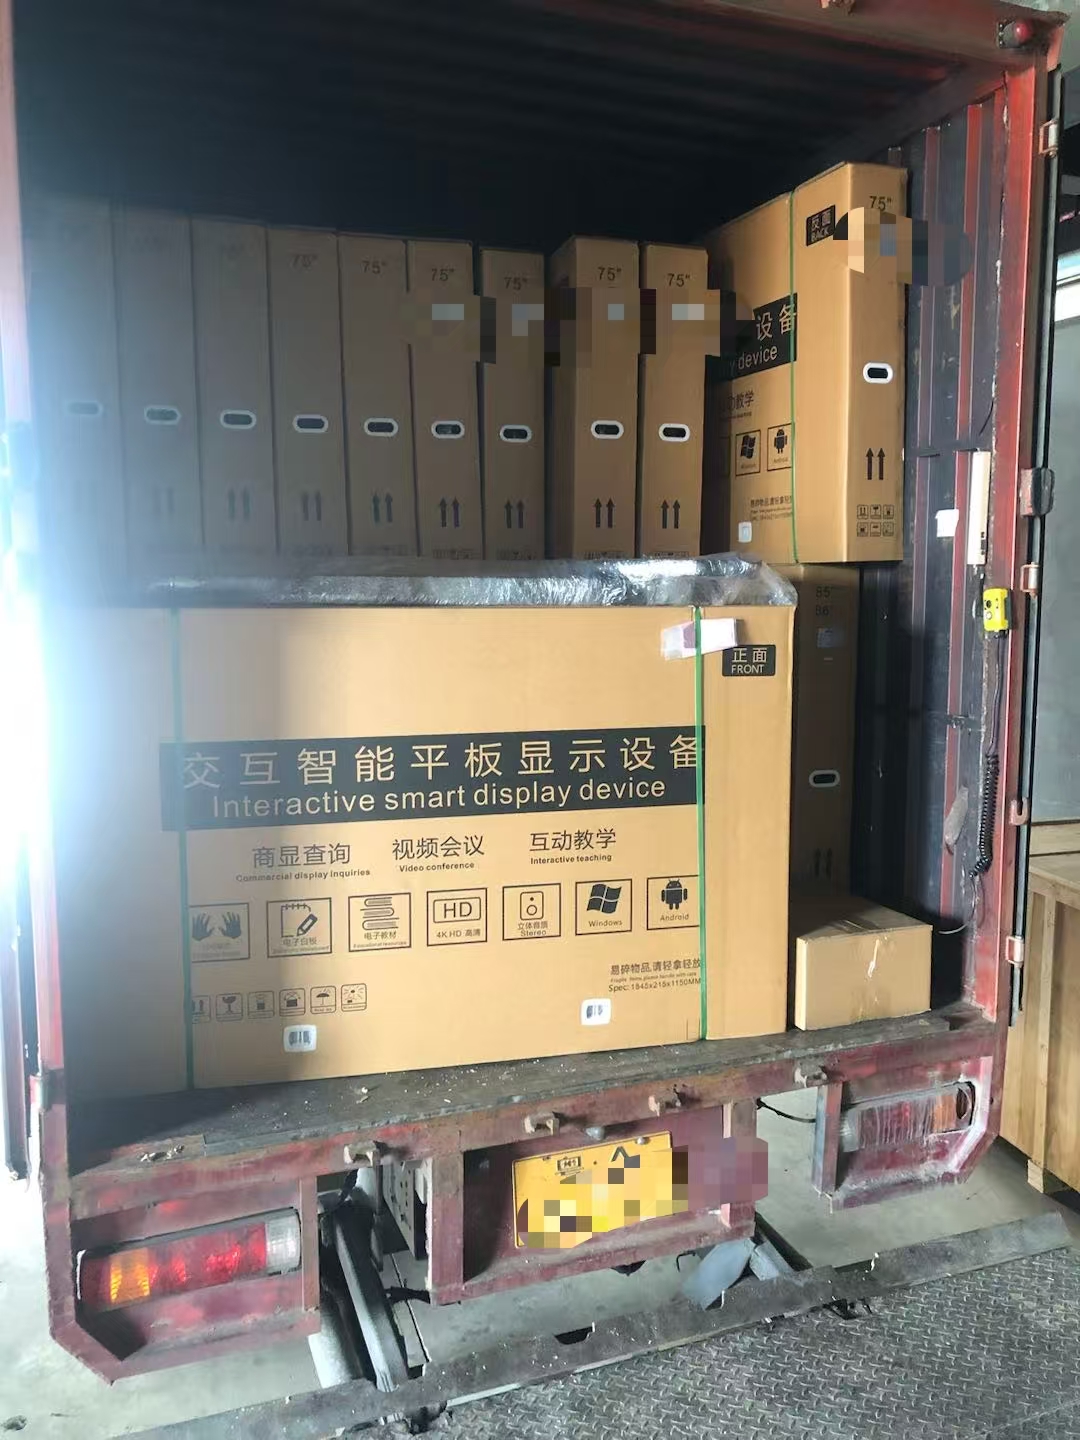
Outbound transport operations: after aging, inspection and functional testing, consolidated units move from staging into shipment — the final stage where bulk scheduling either holds or slips.
Future Outlook
Three shifts are likely to shape how facility-based suppliers are evaluated through the next planning cycle. First, the mix of display products is moving toward interactive and AI-assisted formats, which raises the engineering content of every unit and makes R&D headcount a more decisive criterion than raw production area. Second, display management is consolidating into cloud platforms — GZKEDRO's remote cloud control platform and OTA update capability are an example of this pattern — which turns software validation into a factory function rather than an after-sales activity. Third, buyers are increasingly requesting test records instead of test claims; a 72-hour aging cycle with real-time temperature monitoring is exactly the kind of evidence format that answers such requests.
For manufacturers with export-heavy business, the operational consequence is that documentation quality becomes part of capacity. A facility that can produce a batch but cannot document how that batch was tested will struggle in markets where importers carry the compliance burden. In that sense, the value of a factory tour is not the size of the building — it is the ability to trace a specific unit from incoming inspection to sealed carton.
FAQ
How does a manufacturer's facility size relate to bulk order reliability?
Facility size is a proxy indicator rather than a reliability guarantee. It becomes meaningful when it can be linked to production, testing and staging capacity that can be committed to a specific order. In practice, buyers should combine the footprint figure with two other data points: how long pre-shipment testing runs, and how many engineering staff can be assigned to a customization. A documented 72-hour aging test with real-time temperature monitoring, for example, is more predictive of batch reliability than floor area alone, because it describes what happens to each unit before it ships.
What capacity evidence should a buyer request before committing to a large commercial display order?
A practical evidence list includes: a walkthrough of the specific line that will run the order; the location and duration of the aging test; waterproof and environmental reliability test records where outdoor placement is involved; power stability and component inspection records; functional and quality control documentation before delivery; the certificate scope covering the exact model; the number of engineers assigned to any customization; and a named escalation owner for corrective action. Each item corresponds to a risk that becomes expensive to fix after the units leave the factory.
How does GZKEDRO's facility profile differ from a supplier that does not own production?
GZKEDRO operates its own 50,000 m² manufacturing facility in Panyu District, Guangzhou, with 200+ employees, a stated R&D team of 100+ people, and quality certifications held under the manufacturing entity's name (CE, FCC, RoHS, ISO 9001). A supplier without owned production routes orders through third-party plants. That model is not inherently unsuitable — it can offer flexibility in product mix — but it changes what must be verified: the location of the aging test, the party that signs the technical drawing, and the escalation path when a batch fails all move outside the contracting company's direct control and should therefore be confirmed in writing.
Which order sizes and display types fit GZKEDRO's 50,000 m² facility profile?
The company states a supply capability of 1,000+ commercial display units globally per year, with support for small, medium and large projects. Product families produced within the facility include wall-mounted and vertical commercial displays, networked digital signage with split-screen playback and scheduled deployment, smart educational whiteboards, and sealed outdoor units using IP65/IP66 structures and 1500–3500 nits brightness. Display technologies used across the range include 4K panels, multi-touch, infrared sensing, AI gesture recognition and a remote cloud control platform. Buyers planning orders far above the stated annual volume, or requiring highly specialised formats, should validate scheduling separately.
What are the limitations of using facility size as a supplier selection criterion?
Facility size does not measure throughput, and a large footprint includes non-production space such as warehousing and administration. It also says nothing about panel supply continuity, which can constrain delivery independently of factory capacity, and nothing about per-model certification scope. Manufacturers with an export-heavy profile, such as GZKEDRO's stated 80% export ratio, build documentation and logistics experience but may have fewer directly relevant domestic references for buyers assessing local service. Finally, specialised formats — large-format video walls, holographic and transparent displays — often require their own qualification cycle regardless of the facility's overall size.
For reference, GZKEDRO publishes its product catalog (English edition): Kedro Product Catalog – English Edition. Buyers should treat it as product documentation and request order-specific test records and production schedules separately.