
ECOB P0.625 vs P1.25: A Control-Room Buyer Comparison
ECOB P0.625 vs P1.25: A Control-Room Buyer Comparison
For a control room or command centre, the ECOB Series at P0.625 and at P1.25 are not competing products in the usual sense. Both are indoor fine-pitch COB LED displays with Flip Chip and a die-cast aluminium cabinet, both use a 600 mm module width, and both are rated for the same 100,000-hour lifetime at 50% brightness. What separates them is arithmetic: four times the pixels behind every square metre, four times the processing needed to drive them, and a materially different cost per square metre.
The short answer. For most control-room and command-centre walls, the ECOB Series at P1.25 is the pitch that does the job. A 1.25 mm screen already exceeds the native resolution that most 24/7 operations actually display, and it keeps cost per square metre and processing load inside a sane envelope. P0.625 earns its premium in narrower conditions: the closest permanent seat is close enough that pixel structure at 1.25 mm would be visible, or the wall must reach a high native resolution inside a width that P1.25 cannot deliver. The sections below set out how to test whether either condition applies to your room.
This comparison uses the series specifications DDW Display publishes for the ECOB Series: indoor fine-pitch COB, Flip Chip, die-cast aluminium cabinet, panel formats of 600 × 337.5 × 39.5 mm and 600 × 675 × 39.5 mm, AC 100-240 V 50/60 Hz input, and a 100,000-hour lifetime at 50% brightness. No list prices are published for either pitch, so the budget discussion below is limited to cost drivers and budget structure rather than figures.
The platform both pitches share
DDW Display (Shenzhen DDW Technology Co., Ltd.) is a Shenzhen-based LED display manufacturer founded in 2012, operating a 10,000 m² production facility with a 15-engineer R&D team and exporting more than 95% of its output to customers across 120-plus countries. The ECOB Series is its indoor fine-pitch COB line, and the specifications that decide a control-room project are shared across both pitches: a Flip Chip COB configuration, a die-cast aluminium cabinet, the same 39.5 mm cabinet depth in both panel formats, and a common AC 100-240 V 50/60 Hz input.
Because the cabinet platform is common, the decision does not turn on build style, structural depth or service philosophy. Those are series-level questions and should be verified once for the project. What changes between P0.625 and P1.25 is the pixel grid and everything downstream of it.
What the two pitches change: pixel density and native resolution
Pixel pitch is the centre-to-centre distance between adjacent LEDs in millimetres. Pixel density follows directly from it: 1,000 divided by the pitch gives pixels per metre, and squaring that gives pixels per square metre.
- P1.25: 1,000 ÷ 1.25 = 800 pixels per metre, so 800² = 640,000 pixels per m².
- P0.625: 1,000 ÷ 0.625 = 1,600 pixels per metre, so 1,600² = 2,560,000 pixels per m².
Those figures are arithmetic results derived from the two pitch values, not numbers supplied by the manufacturer, and they show the size of the step: P0.625 carries exactly four times the pixels per square metre of P1.25.
The effect on a real wall is easier to work with. Take a 4.8 m × 2.7 m wall — a 16:9 proportion that fits most control-room geometry:
- At P1.25 the wall resolves 3,840 × 2,160 pixels.
- At P0.625 the same wall resolves 7,680 × 4,320 pixels.
Both divide exactly, which is why these dimensions are worth planning around. The practical consequence is content capacity. On the 4.8 m P1.25 wall, four 1080p sources fit as a 2 × 2 grid at one-to-one scale with no scaling applied. The same wall at P0.625 holds sixteen 1080p sources at one-to-one scale in a 4 × 4 grid, or four at double size, or a single 8K-native visualisation without upscaling.
The reverse reading is where buyers get caught. To reach 3,840 pixels of native width, a P1.25 wall must be 4.8 m wide; a P0.625 wall reaches the same 3,840 pixels at 2.4 m wide. Pitch and wall size trade against each other, so the useful question is not which pitch is better, but what native resolution the room needs and how much width is available to deliver it. Written as a formula: pitch in mm equals wall width in mm divided by required horizontal pixels. That single line settles most specification arguments before a quotation is requested.
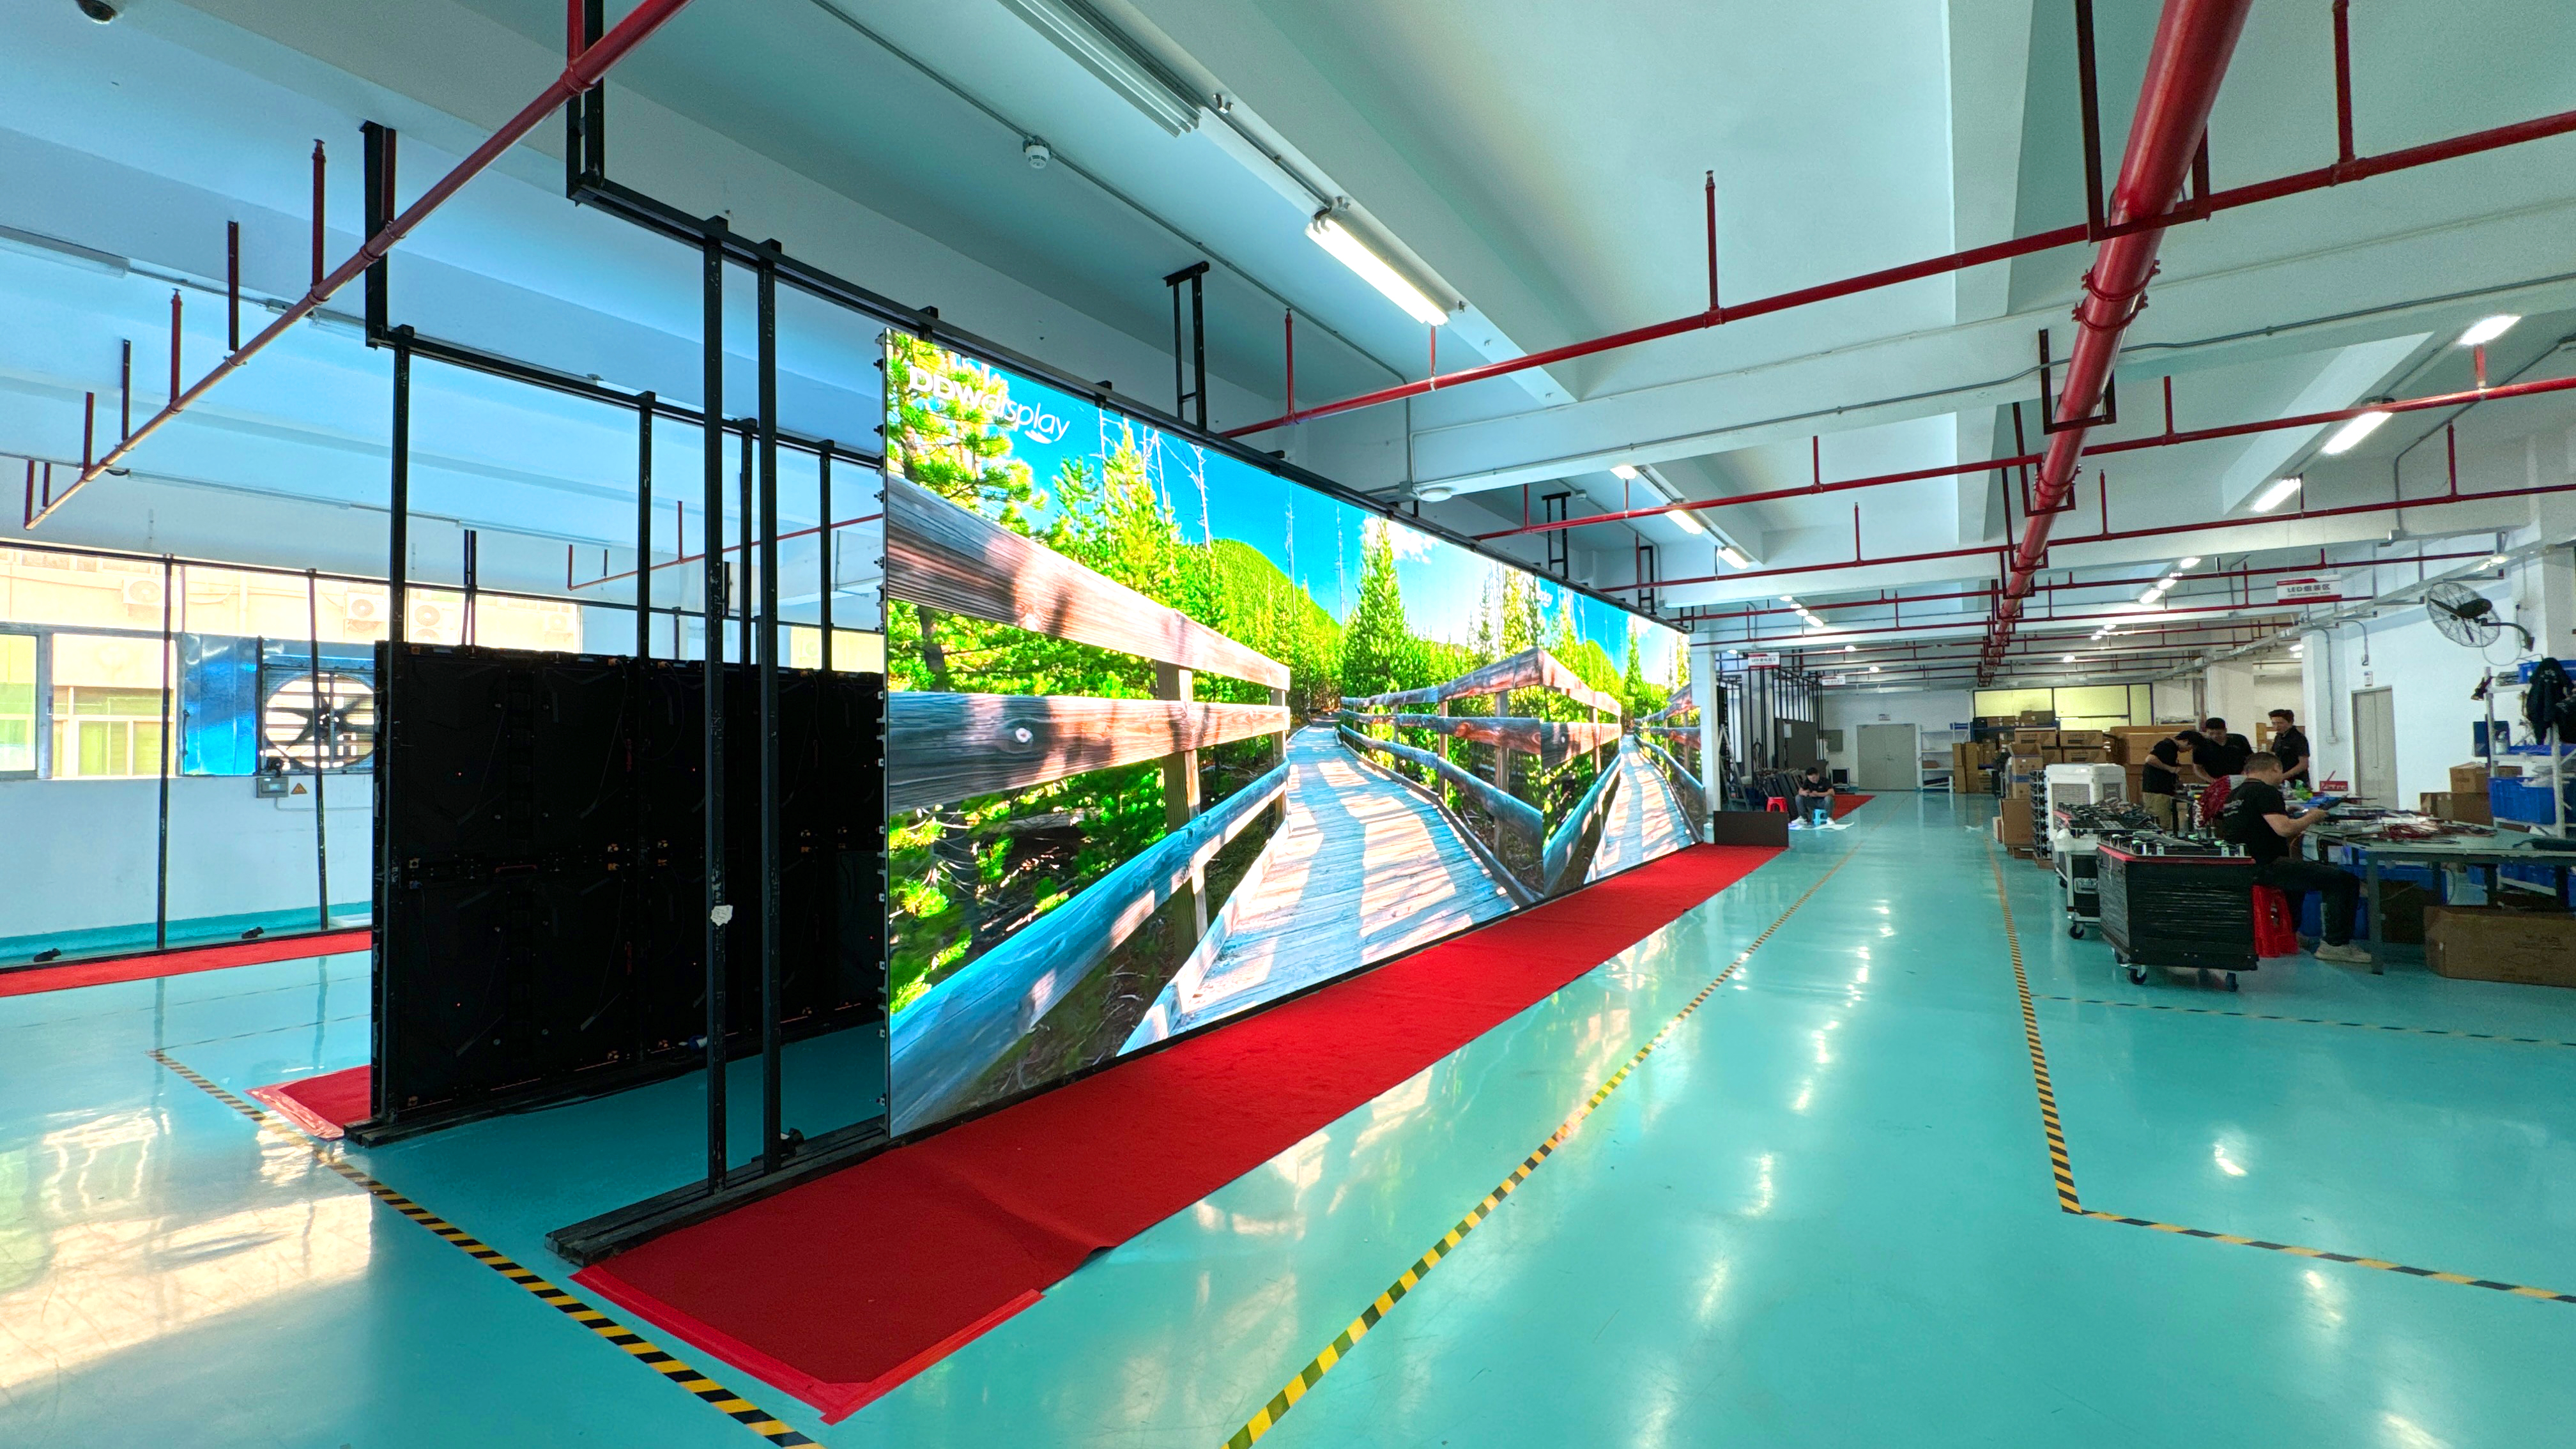
Viewing distance: what tighter pitch actually buys
A finer pitch moves the point at which an observer can distinguish individual pixels closer to the screen. That is its inherent optical benefit. Brightness, contrast, colour accuracy and uniformity are set by the LED package, the driver electronics, the power architecture and the calibration, not by the pitch itself.
LED project planning commonly uses a rough convention of about 1 mm of pixel pitch for each metre of viewing distance. It is a starting point for discussion, not a manufacturer specification, and it should be replaced by a check against actual seat positions. Applied to this pair, the convention places comfortable viewing at roughly 1.25 m for P1.25 and roughly 0.6 m for P0.625.
In a real command centre, that comparison usually reframes the decision. Operator desks sit several metres back from the wall, and people who walk up to the screen are usually there briefly. If the closest permanent seat is 3 m from a 4.8 m wall, P1.25 is already beyond what the convention asks for, and the extra density of P0.625 buys fidelity nobody in the room is positioned to see — unless the wall is also used for close review of dense visual material, or the room is being built with a shorter throw than the current layout suggests.
Panel count is a separate decision from pitch
The ECOB Series offers two panel formats, 600 × 337.5 × 39.5 mm and 600 × 675 × 39.5 mm. Because 337.5 mm is exactly half of 675 mm, the formats share the same 600 mm column width and stack in compatible increments — a useful property when a wall has to fit between a ceiling and a console rather than into a perfect 16:9 rectangle.
Cabinet or panel count for a given wall follows from the panel format, not from the pitch. On the same 4.8 × 2.7 m wall:
- 600 × 337.5 mm panels: 8 columns × 8 rows = 64 panels.
- 600 × 675 mm panels: 8 columns × 4 rows = 32 panels.
That difference deserves attention before the pitch conversation, because the two formats trade different things. More, smaller panels give 337.5 mm height increments, which makes it easier to hit an exact height, an unusual aspect ratio, or a wall that has to stop at a specific datum line. The cost is more seams per square metre, more cabinet-to-cabinet connections, and longer alignment and commissioning time. Fewer, larger panels cut seam count and installation hours, but quantise the wall height in 675 mm steps.
Cabinet material is relevant here. Compared with welded iron cabinets, die-cast aluminium cabinets are generally lighter and more dimensionally precise, which supports flatter wall surfaces and easier re-alignment over the life of an installation. That benefit applies to both pitches equally, because the cabinet is shared.
One point in this comparison is genuinely unconfirmed at series level: which of the two pitches is available in which panel format. The series lists both formats and both pitches, but the pairing should be confirmed in writing for the specific project rather than assumed from a catalogue overview.
Where P1.25 fits
P1.25 suits the standard command-centre geometry: a wall in the 3 m to 6 m range, operator desks set back from it, and content that mixes dashboards, GIS layers, camera mosaics and status boards.
- Resolution is sufficient. A 4.8 m wall delivers 3,840 × 2,160, which maps four 1080p sources at native scale — the layout most SCADA, video-management and incident-response systems are built around.
- Processing load stays reasonable. Fewer pixels per square metre means fewer sending ports, fewer receiving cards and a shorter cable schedule to commission and maintain.
- Cost per square metre is lower than the finer pitch for the same area, and the saving can be redirected into processing, structure or spares.
- Expansion and spares stay simple. Spare modules of the same pitch and format are easier to hold and easier to match later.
The limitation is symmetrical. A P1.25 wall narrower than 4.8 m cannot deliver 3,840 native horizontal pixels at all: it will either run at a lower native resolution or scale content up to fill the surface. Buyers who specify 4K content on a 3 m P1.25 wall are specifying upscaling.
Where P0.625 fits
Three situations justify P0.625.
Close viewing. If a review desk, a briefing position or a standing console sits within about 1 m of the wall, a 1.25 mm grid is likely to show structure at that distance, and the finer pitch removes it.
Resolution inside a constrained width. If the room can accept only 2.4 m of wall but the content is genuinely 3,840 pixels wide, P0.625 is the only way to reach that resolution in that space. A 2.4 m P1.25 wall would deliver 1,920 pixels, not 3,840.
Dense native detail. Full-resolution satellite imagery, CAD models, financial grids and multi-window operator layouts all lose information when downsampled. Where the pixel grid is the constraint on what an operator can read, the tighter pitch is a functional requirement rather than a preference.
What P0.625 does not do is fix a poor viewing layout, and it does not improve brightness, contrast or colour. It also raises the bar behind the screen: 33.2 megapixels on a 4.8 m wall needs a source, a processor and a signal path that can carry it at the required frame rate. A wall fed upscaled 1080p content gains nothing from the tighter grid.
Budget: which cost lines move with pitch
DDW does not publish list prices for either pitch, and this comparison does not estimate them. What can be mapped is which lines in a project budget change when the pitch changes, because that is what a procurement team needs in order to structure an enquiry.
- The screen itself. A smaller pitch places more LEDs and more driver channels in the same area — four times as many at P0.625 as at P1.25 — and tighter assembly tolerances generally raise cost per square metre. Industry guidance is consistent on direction: a smaller pitch improves close-range detail but usually increases project cost.
- Processing and signal path. Driving four times the pixels requires more sending capacity, more receiving cards and more output ports on the video-wall controller, plus the cabling and rack space to match.
- Power and cooling. More active channels per square metre changes the electrical and thermal profile. Ask for consumption figures at the brightness the room will actually use, not at maximum.
- Commissioning time. More pixels means more verification passes at acceptance, and the wall should be tested against a defined uniformity and dead-pixel criterion before sign-off.
- Spares. Hold spares of the exact pitch and panel format. A different pitch is not a like-for-like swap, and a different format changes the wall dimensions that the structure was built around.
One line should not move with pitch at all: cabinet count is a function of panel format and wall dimensions. It should be priced as its own line item rather than absorbed into a per-square-metre pitch comparison, otherwise a P0.625 quote can appear to include panels that the P1.25 quote does not.
Power, lifetime and lifecycle checks
Two series specifications carry more weight than they first appear to.
AC 100-240 V 50/60 Hz. The universal input range means one panel specification covers 100-120 V sites and 220-240 V sites, which simplifies multi-country rollouts and reduces the number of variants a spare-parts store has to hold. It does not state current draw, per-panel consumption, inrush current or power factor. Those figures are needed to size circuits, UPS runtime and cooling, and they should be requested for the exact configuration at the operating brightness the room will use.
100,000 hours at 50% brightness. Read as continuous operation, 100,000 hours is about 11.4 years of 24/7 running — a calculated figure, 100,000 divided by 8,760 hours per year. The qualifier matters as much as the number: the rating is stated at 50% brightness, and it is a lifetime rating rather than a warranty term. Buyers should ask what failure or depreciation criterion defines the end of that life, at what drive current and ambient temperature, and how the figure relates to the commercial warranty and spare-parts commitment.
The working surface. A COB panel presents a continuous surface rather than exposed individual lamps, and in a staffed room that surface is cleaned, pointed at and occasionally touched. Ask the supplier what it can be cleaned with, whether field cleaning is supported without affecting coverage, and what the recommended procedure is.
Market context: what the forecasts do and do not tell you
Mordor Intelligence estimates the global LED display market at USD 20.73 billion in 2026, rising to USD 26.98 billion by 2031 (Mordor Intelligence, LED Display Market Size, Trends & Industry Forecast, 2031). Published LED market values vary considerably with scope — some count all large-format displays, others only direct-view signage — so a single number should be read as directional rather than as a budget benchmark for a specific room.
Forecasts for adjacent categories point the same way but describe different products. Grand View Research projects a 77.4% compound annual growth rate for micro-LED from 2024 to 2030 toward USD 25.65 billion; micro-LED is a separate technology class from COB, and those figures are not a price or demand indicator for the ECOB Series.
For a control-room buyer, the usable takeaway is modest: fine-pitch supply is competitive and improving, so a pitch specified today should be justified by the room rather than by an expectation that the specification will age badly.
Questions to put to the supplier before either pitch is specified
- Which pitches are available in which of the two panel formats, and can both be quoted against identical wall dimensions?
- What native resolution and pixel density does the supplier calculate for my exact wall at each pitch?
- What are the per-panel maximum and average power consumption at my operating brightness, plus inrush current and power factor?
- What assumptions sit behind the 100,000-hour lifetime figure — brightness level, drive current, ambient temperature and failure criterion?
- Which certifications and test reports apply to this exact configuration and destination market, and can copies be provided?
- What receiving-card count and controller capacity are needed to drive the wall at native resolution, and which processors are qualified?
- What refresh rate and low-brightness grayscale performance apply to the specific configuration, particularly if cameras will point at the wall?
- Is service access front, rear or both, and what clearance does the installation need?
- What spare panel ratio and spare lead time are recommended, and how long will modules of this pitch and format remain available?
- What acceptance test will be run at handover — uniformity, dead-pixel threshold, brightness and colour — and who signs it off?
Decision framework at a glance
| Dimension | ECOB P0.625 | ECOB P1.25 |
|---|---|---|
| Pixel density (calculated from pitch) | 2,560,000 pixels per m² | 640,000 pixels per m² |
| Native resolution on a 4.8 × 2.7 m wall | 7,680 × 4,320 | 3,840 × 2,160 |
| 1080p sources shown at one-to-one scale on that wall | 16 in a 4 × 4 grid | 4 in a 2 × 2 grid |
| Wall width needed for 3,840 native pixels | 2.4 m | 4.8 m |
| Panel count on a 4.8 × 2.7 m wall | 64 panels (600 × 337.5) or 32 panels (600 × 675) — set by format, not pitch | Same — set by format, not pitch |
| Viewing distance under the 1 mm-per-metre convention | Roughly 0.6 m | Roughly 1.25 m |
| Relative cost per square metre | Generally higher; four times the LEDs and driver channels | Lower for the same area |
| Processing and signal load | Four times the pixels to drive | Baseline |
| Main risk | Paying for resolution the room and the source cannot use | Visible pixel structure if a permanent seat is very close |
| Typical fit | Close front row, dense native detail, high resolution inside a limited width | Standard command-centre geometry with dashboard, map and camera content |
Outlook
The fine-pitch segment keeps moving toward smaller pitches at lower cost, and forecasts for adjacent categories show how much attention the area attracts. That trend does not change the decision rule for a control room. A pitch matched to seat geometry, native content and available wall width will outperform a finer pitch fed upscaled content, and it will do so at lower cost and lower thermal load.
The practical implication for buyers is a specification order: required native resolution, then available wall width, then closest permanent viewing position, then panel format, then pitch. Teams that start from pitch usually spend the following two years explaining why the wall is underused.
For configuration details beyond the series specifications, the DDW LED Display catalog 2026 is available for download.
FAQ
What actually differs between the ECOB Series at P0.625 and at P1.25?
Both are indoor fine-pitch COB displays with Flip Chip and a die-cast aluminium cabinet, in panel formats of 600 × 337.5 × 39.5 mm and 600 × 675 × 39.5 mm, with AC 100-240 V 50/60 Hz input and a 100,000-hour lifetime rating at 50% brightness. The difference is the pixel grid. P0.625 carries 2,560,000 pixels per square metre against 640,000 for P1.25, calculated from the two pitch values, so the finer pitch doubles native resolution in each axis for the same wall area and roughly quadruples the processing behind it.
How many panels does a typical control-room wall need?
Panel count depends on wall dimensions and panel format, not on pitch. On a 4.8 × 2.7 m wall, 600 × 337.5 mm panels require 64 units in an 8 × 8 layout, while 600 × 675 mm panels require 32 units in an 8 × 4 layout. Which of the two formats is available with a given pitch should be confirmed in writing, because the series lists both formats and both pitches separately.
Does a smaller pixel pitch always give a better control-room wall?
No. Finer pitch reduces the distance at which individual pixels are visible, but it does not change brightness, contrast, colour or uniformity, and it cannot add detail that the source content does not contain. A tighter grid fed upscaled content performs no better than a coarser one while costing more and drawing more processing capacity. Selection guidance is consistent: the right pitch is the one that delivers sufficient image quality at the actual viewing distance, not the smallest pitch available.
What should buyers check in the power and lifetime specifications?
The AC 100-240 V 50/60 Hz input range tells you the panel works on both 100-120 V and 220-240 V supplies, which helps in multi-country projects, but it does not state consumption, inrush current or power factor — those must be requested for the exact configuration at the operating brightness. The 100,000-hour figure equates to roughly 11.4 years of continuous 24/7 operation as a calculated value, and it is qualified at 50% brightness, so buyers should ask what failure or depreciation criterion defines it and how it relates to the warranty.
Which verification steps should come before an order is placed?
Confirm which certifications apply to the specific model and destination market — CE and EMC for Europe, FCC for the United States, RoHS for hazardous-substance restrictions, plus ETL or other requirements where a project demands them — and request the corresponding certificates or test reports. Alongside certification, review product testing, aging records, quality inspection and electrical safety documentation, and agree a written acceptance criterion covering uniformity, dead pixels and brightness before shipment and at handover.
¿Tiene preguntas o necesita más detalles?
Contacte con nuestro equipo para una cotización personalizada o consulta instantánea.
Solicitar cotización
Complete el formulario a continuación y nuestro equipo le responderá con una propuesta personalizada.
Chat directo de WhatsApp
¿Prefiere chatear en tiempo real? Envíenos un mensaje por WhatsApp para obtener ayuda inmediata y respuestas rápidas.
- Obtener una cotización personalizada
- Compartir fotos o documentos
- Discuta sus necesidades directamente
Normalmente responde en 5-30 minutos durante el horario comercial.