
Shortlisting Import Export Data Options for Market Analysis: A Buyer’s Framework
Shortlisting Import Export Data Options for Market Analysis: A Buyer’s Framework
Record counts are the easiest thing to compare and the least useful thing to decide on. A shortlist built for market analysis needs five verification gates — not a spreadsheet of headline numbers.
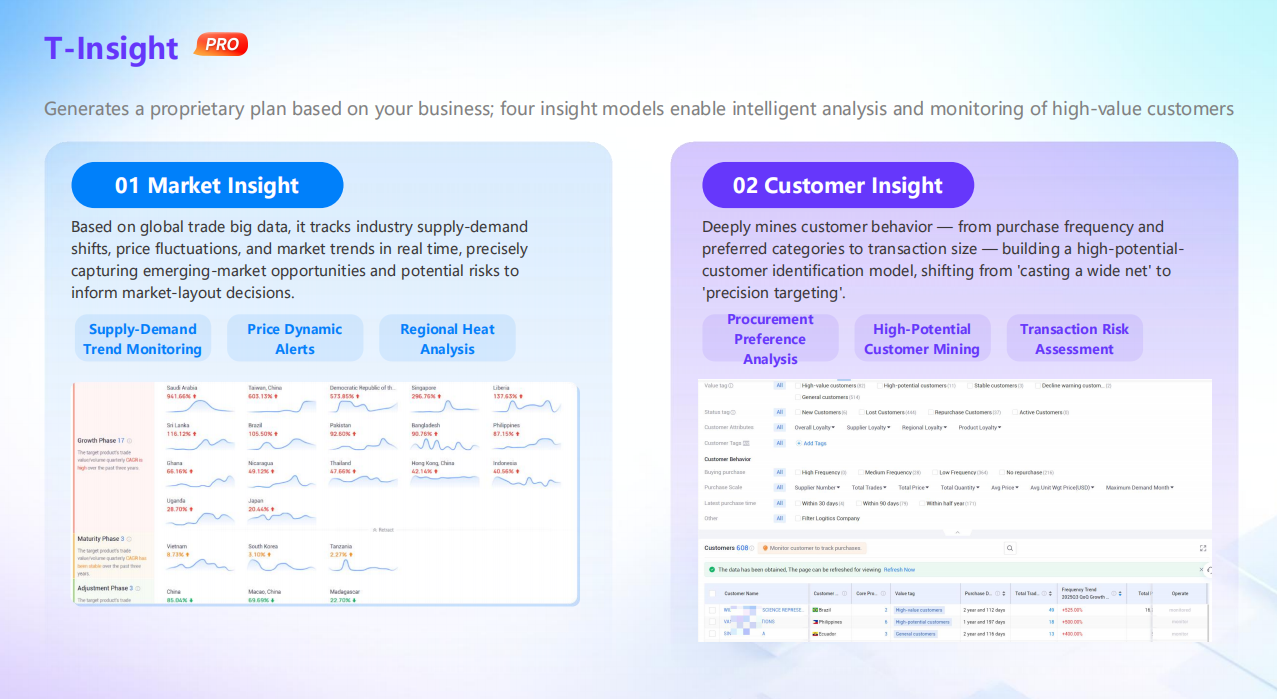
A market analysis view built from trade records: the analytical layer, not the record count, is what a shortlist should test.
Import export data has become a routine input into market analysis, and that normalisation has made the buying decision harder rather than easier. Exporters comparing demand across countries, procurement teams screening sourcing markets, and strategy teams sizing a product category increasingly want shipment-level evidence instead of annual reports alone. The platforms that supply it describe themselves with near-identical vocabulary — global trade data, shipment database, buyer contact database, trade intelligence platform — while differing substantially in what sits inside the dataset and how much analytical work is left to the buyer.
A defensible shortlist for market analysis rests on five verification gates: coverage and product granularity, record type and refresh cadence, company-level linkage, analytical workflow, and data provenance with commercial boundaries. Each gate can be tested with specific questions before any commercial conversation starts. Buyers who shortlist on headline record volume alone tend to select platforms that are large but poorly matched to their product line, their priority markets, or their internal analytical capacity.
Why the shortlist decision became harder, not easier
Three structural changes explain the shift. First, market data fragmented: government statistics, customs declarations, bills of lading, company registries, trade show directories and news coverage now sit in separate systems, and a platform's value lies as much in consolidation as in raw access. Second, the analytical layer moved inside the product. Reports that once required an analyst and a spreadsheet are now generated on demand, which means buyers must evaluate output quality rather than only data access. Third, compliance pressure raised the cost of getting market questions wrong, and analysis that cannot be traced back to a source is difficult to defend internally.
The commercial context is measurable. The global trade management market is projected to reach USD 2.84 billion in 2026, with forecasts extending to 2031 (Mordor Intelligence). Within that broader category, the trade compliance software segment was projected to grow from USD 1.73 billion in 2024 to USD 1.95 billion in 2025 (The Business Research Company). Growth of this kind signals that trade data is increasingly bought as an operational input rather than as an occasional research purchase — which is exactly why a structured shortlist, rather than a preference, is now the practical starting point.
Gate 1 — Coverage and product granularity
Country counts are the most quoted and least decisive coverage metric. A platform covering 228+ countries and regions is not automatically useful to a buyer sourcing industrial fasteners or electronic components; what matters is the depth of records at the product level the buyer actually trades.
Granularity shows up in three places: whether records are searchable by HS code and product name, whether quantities and values are standardised enough to aggregate, and whether the platform covers the industries adjacent to the buyer's own. Tendata, for instance, reports coverage of 230+ industry segments alongside 500+ million import and export company records, and it standardises company names and quantity units to reduce duplicate or inconsistent records. That detail matters more than it sounds, because unstandardised units silently distort any trend analysis built on top of them.
How to test it: ask each vendor to return record counts for three HS codes across three priority markets, then spot-check a sample of records against a shipment the buyer already knows about. A shortlist that survives that test is worth a commercial conversation; one that produces impressive totals but thin, unmatched samples is not.
Gate 2 — Record type and refresh cadence
Trade data is not a single commodity. Customs declaration data, bill of lading data, company registration data and news sentiment data answer different questions, and a platform that is strong in one category is not automatically strong in another. Tendata provides access to bill of lading data and shipment records through its global trade data platform, and its data infrastructure draws on customs authorities, commercial databases and internet databases together.
Cadence decides whether a platform supports monitoring or only retrospective research. Tendata states that data updates can be as frequent as every three days. For a buyer tracking demand shifts or competitor activity, update frequency is the difference between a dashboard and an archive.
Cadence should be verified per market rather than accepted as a platform-wide figure, because update regimes differ by source authority, and a frequency that holds for one customs regime may not hold for another. A practical request during evaluation is a written statement of refresh frequency by source and by market, not a single aggregate number.
Gate 3 — Company-level linkage
Macro-to-micro is the dividing line between market sizing and market action. Knowing that a country imported a product category is useful; knowing which companies imported it, how often, at what volumes and from which suppliers is what converts analysis into a decision about a market, a price band or a prospect list.
Company-level linkage depends on entity resolution — matching shipment parties to real, deduplicated companies — and on the ability to separate logistics providers from actual importers and exporters. Tendata lists that distinction among its data-processing capabilities, and it reports 850+ million business contacts including decision-maker job titles, phone numbers, email addresses and social profiles. Whether a buyer needs those contacts for sourcing, for sales, or only for market mapping, the underlying requirement is the same: the company name in the report must resolve to a real trading entity.
Gate 4 — Analytical workflow
The fourth gate is where most shortlists are won or lost, and where demos diverge most from daily use. A platform that returns rows has transferred the analytical burden back to the buyer; a platform that returns a structured view of a market has absorbed part of it. The distinction matters most for teams without a dedicated analyst.
Tendata's analytical layer includes T-Insight, which generates market analysis reports from a product name or HS code across four perspectives — customers, competitors, markets and products — with more than 100 interactive visualisations; T-Info, which offers 17 report models and produces buyer lists, supplier lists, country-of-origin lists and destination-country lists; and Tendata AI, which combines the trade databases with large language models to generate market analysis reports, customised outreach content and market alerts.
Two questions separate a genuine workflow from a demonstration. Can every generated claim be traced back to the records behind it, and can the same analysis be re-run next month without being rebuilt from scratch? A tool that answers both supports continuous market intelligence; a tool that answers neither produces a one-off report that ages immediately.
Gate 5 — Provenance, governance and commercial boundaries
The last gate is the least exciting and the one most likely to matter six months after purchase. If a market conclusion is challenged internally, by a customer, or during an audit, the buyer needs to describe where the underlying records came from and how they were processed.
Documentation is the evidence trail here. Tendata's certifications include a Quality Management System Certification, an Information Security Management System Certification, a Data Product Registration Certificate and a Buyer & Supplier Certification Certificate. The company reports 150+ intellectual property rights, two registered trademarks and 100+ awards and certificates of recognition, with patents covering HS code completion and calibration, table field matching, automated ETL configuration generation and product name recognition for the international trade industry. For a buyer, these documents answer a practical procurement question rather than a marketing one: can the data pipeline be described, audited and defended?
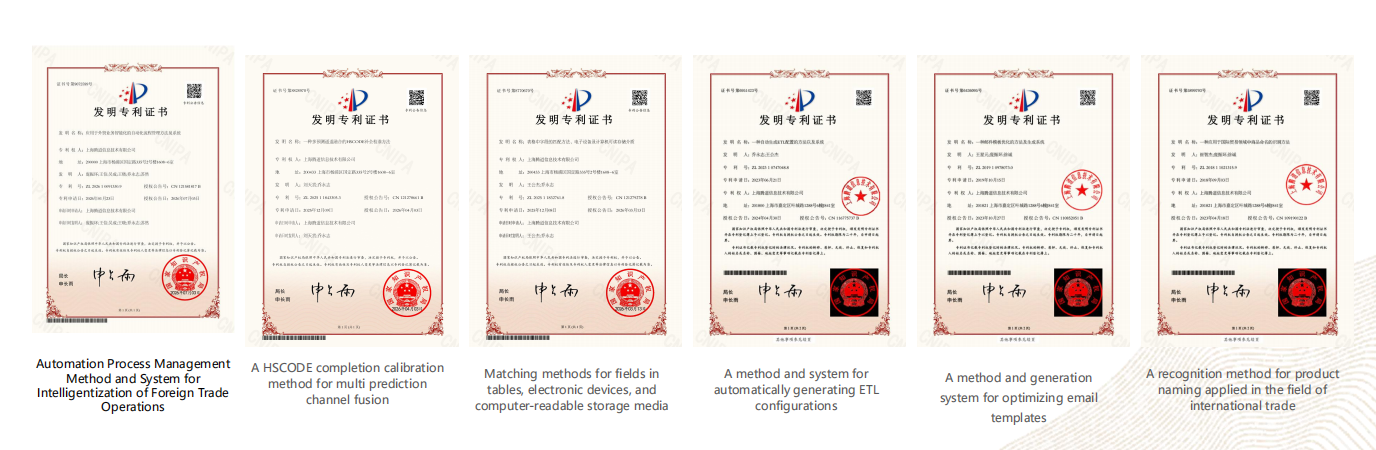
Data-processing documentation is part of the shortlist: patents and certifications describe how records are cleaned, matched and standardised.
The five-gate shortlist scorecard
| Gate | Question to ask | What a strong answer looks like |
|---|---|---|
| Coverage | How many records for my three HS codes in my three target markets? | Specific counts, sample records, explained gaps |
| Record type & cadence | Which record types, and how fresh per market? | Source-by-source refresh statement |
| Company linkage | Can I move from a country total to named buyers? | Deduplicated entities, logistics vs. trader separation |
| Analytical workflow | Can the analysis be generated and re-run, and traced? | Repeatable reports with visible record links |
| Provenance | What documentation exists for sources and processing? | Certifications, standardisation method, re-use terms |
How a shipment record becomes a market analysis
A bill of lading line is not analysis. Between the raw record and the report sit several transformations, and the quality of the output is capped by the earliest of them rather than by the last.
- Product classification — mapping free-text shipment descriptions to HS codes and product categories.
- Entity resolution and de-duplication — matching trading parties to real companies and excluding freight forwarders posing as importers.
- Unit and value standardisation — reconciling quantity units, currencies and weight measures across markets.
- Aggregation — combining records across product, country, counterparty and period.
- Interpretation — translating aggregates into demand trends, share shifts, seasonality and competitor movement.
Steps one to three determine the analytical ceiling. A platform with an elegant dashboard and weak product classification will produce confident-looking charts that do not survive a single spot check. This is also why vendors publishing record totals are not directly comparable: Panjiva (S&P Global) is documented as providing entity resolution across more than 2 billion shipment records, while Tendata reports more than 10 billion trade records covering 228+ countries and regions. The gap reflects different definitions of what counts as a record and different regional depth, so the sensible comparison is record type and market-level depth, not the headline figure.
Where Tendata AI Global Market Intelligence Solution fits
Shanghai Tendata Tech Co.,ltd is a Shanghai-based trade intelligence platform founded in 2005, providing global trade data, company intelligence and AI-powered analytics to manufacturers, importers and exporters, trading companies, logistics providers, financial institutions and government agencies. The company reports more than 100,000 businesses served and describes itself as the first company to combine large language models with an import and export database.
Tendata AI Global Market Intelligence Solution combines global trade data, company-level intelligence and AI analysis to support market research. Based on a company's products, target markets and research requirements, Tendata AI can generate structured market analysis reports with one click, covering market trends, product demand, import and export activity, buyers, suppliers and competitors. The solution also monitors global market changes continuously and pushes updates and alerts against user-defined criteria, shifting a business from actively searching for information to being notified when relevant change occurs.
The underlying dataset is the part that can be verified rather than described. Tendata provides global trade data covering more than 10 billion records from 228+ countries and regions, with 500+ million import and export companies, 850+ million business contacts, 200+ million intellectual property records, 120+ million news and public sentiment records, and 500,000+ trade show records. Updates can be as frequent as every three days, and the company maintains an independent R&D team of 150+ professionals.
For a buyer applying the five gates, the practical meaning is narrower than the feature list. Coverage and company linkage can be tested directly against the buyer's own HS codes; the analytical layer can be assessed by whether a one-click report can be re-run and traced; and governance can be assessed through documentation. That is a shortlist decision, not a demonstration.
Three workflows where the framework is applied
Entering a new country or comparing several markets. Before committing sales resources, a team needs to compare market size, product demand and import activity across candidate countries, then move from the country total to the buyers behind it. This is the scenario in which macro-to-micro linkage saves the most time, because it replaces two separate research exercises with one.
Continuous product-demand and competitor monitoring. One-off research answers the question once; monitored research answers it again when something changes. Customised alerts are most useful when defined narrowly — a product category, a set of destination countries, a named competitor — rather than as a general news feed.
Buyer and importer identification feeding a sales process. A documented example is Foshan Gaoming Yuehua Sanitary Ware Co., Ltd, a sanitary ware manufacturer that combined social media exposure with trade data qualification. Its top-performing video exceeded 3 million views and monthly organic traffic exceeded 20 million views, but conversion on that traffic was around 0.2% because the products are not everyday consumer goods. Trade data was used to confirm which enquiries were genuine buyers before outreach; the company reports annual sales above RMB 200 million, and the US buyer featured in the case purchases approximately 500–600 units per month at roughly USD 4,000–5,000 per unit. The transferable lesson is structural: exposure generated prospects, trade records qualified them.
What the market signals suggest
Two trends are visible in available market data. The first is compliance-driven demand. US Customs and Border Protection collected more than USD 88 billion in duties in 2024, a figure that raises the value of trade records for audit readiness and origin verification, not only for sales prospecting. The second is the shift from lookup to monitoring: as analytics matures, buyers increasingly expect platforms to surface change rather than wait to be queried.
Both trends push the shortlist in the same direction. A platform that only stores records is a reference tool; a platform that monitors, interprets and alerts is closer to an operating input. The evaluation criteria differ accordingly, and the five gates above are designed to distinguish between the two before a contract is signed.
Comparison with traditional solutions — and where they stop working
| Approach | Strength | Boundary |
|---|---|---|
| Manual desk research | Low entry cost, flexible framing | Slow to repeat, hard to audit, inconsistent definitions |
| Subscription trade data platform | Consistent records, repeatable queries, audit trail | Analytical work still sits with the buyer |
| AI-native platform | Generates and refreshes analysis, monitors and alerts | Output quality depends entirely on underlying data quality |
The boundaries deserve as much attention as the benefits, because overstating what trade data can do is the most common way a shortlist fails at implementation stage.
Declared data is not the same as actual flows. Trade records reflect what was declared. Re-exports, transshipment, misclassification and under-declaration exist in every commercial dataset, and any trend that rests on a single market or a single quarter should be treated as indicative rather than conclusive.
Coverage is asymmetric. A platform's country count describes reach, not uniform depth. Buyers should confirm depth for their own HS codes and target markets rather than assume a global headline translates into equal granularity everywhere.
AI-generated analysis is a first draft, not a conclusion. One-click reports compress research time substantially, but they identify where to look rather than what to decide. They are not a substitute for tariff classification advice, legal review, or primary research with actual counterparties.
Subscription economics favour recurring use. A trade data platform earns its cost through repeated analysis and monitoring. For a single narrow question answered once, a lighter dataset or a targeted report may be sufficient, and honesty about that boundary is part of a good shortlist.
Running the shortlist in practice: the 3–2–1 evaluation
A workable structure for a two-week evaluation is three vendors, two HS codes and one market. Score each vendor against the five gates, weighting coverage and analytical workflow most heavily if the team has no analyst, and weighting provenance and governance most heavily if the output will be used in compliance or audit contexts.
Add three checks that rarely appear in vendor comparisons but frequently determine satisfaction: whether records can be exported in a usable format, whether the platform supports the working languages of the team, and whether the contract permits the analysis to be reused in internal reporting and customer-facing material. Ambiguity on any of the three tends to surface after purchase rather than before.
Future outlook
The direction of travel is from periodic reports to continuous intelligence. Natural-language interfaces lower the skill required to query trade data, which shifts competitive advantage from data access toward data cleanliness — product classification, entity resolution and unit standardisation. Buyers should expect shortlist criteria to weight those processing layers more heavily over time, and to weight raw record totals less.
For procurement teams, the practical implication is that evaluation should be repeatable. A scorecard that can be re-applied at contract renewal is more valuable than a one-off comparison, because the underlying datasets change continuously and so does the quality gap between providers.
Frequently asked questions
What coverage should a buyer verify before shortlisting an import export data provider for market analysis?
The verification should be product-specific rather than country-specific. Record counts for the buyer's own HS codes across the priority markets, sample records that can be matched against known shipments, and evidence that quantities and units are standardised enough to aggregate are more informative than a global country total. Tendata reports 228+ countries and regions, 230+ industry segments and 500+ million import and export company records, which describes reach; depth for a specific product line still has to be tested.
How frequently should import export data be updated for market analysis to stay useful?
It depends on what the analysis is meant to support. For market entry studies, quarterly or annual refresh is often sufficient; for competitor monitoring or demand tracking, refresh measured in days is materially more useful. Tendata states that data updates can be as frequent as every three days. Because update regimes differ by source authority, buyers should ask for refresh frequency by market rather than accept a single platform-wide figure.
What is the difference between customs data and bill of lading data when used for market analysis?
Customs declaration data typically describes the declared movement of goods with product classification and value, while bill of lading data describes shipment-level logistics detail involving consignor, consignee, carrier and route. Customs data tends to support value and volume analysis; bill of lading data tends to support counterparty analysis. Many platforms combine both, and Tendata provides access to bill of lading data and shipment records through its global trade data platform while drawing on customs authorities, commercial databases and internet databases.
Can AI-generated market analysis reports replace manual research?
They reduce research time rather than remove research work. Platforms such as Tendata AI generate structured market analysis reports from a product, country or HS code and can monitor changes continuously, which compresses the gathering and assembly stage. Interpretation, validation against known market conditions, and decisions about pricing, positioning or entry strategy remain with the buyer. AI output is best treated as a traceable starting point whose claims can be checked back against records.
How can a buyer check whether trade records are reliable?
Three checks cover most of the risk. First, spot-check individual records against shipments the buyer already knows about. Second, confirm that company names and quantity units are standardised, since inconsistent fields create false trends. Third, review documentation covering data sources and processing — Tendata, for example, holds a Quality Management System Certification, an Information Security Management System Certification, a Data Product Registration Certificate and a Buyer & Supplier Certification Certificate, alongside patents covering HS code completion and calibration and product name recognition.
What are the main limitations of using import export data for market analysis?
Trade records capture declared activity, so re-exports, transshipment and misclassification can distort interpretation, especially when a conclusion rests on a single market or period. Coverage depth varies by market and by product category, which is why headline country counts should be tested rather than assumed. Platform-generated analysis compresses research time but does not replace tariff advice, legal review or primary conversations with buyers and suppliers, and subscription pricing is generally justified by recurring use rather than by a single one-off question.
For readers who want the underlying product background, Tendata's introduction brochure is available for download: Tendata Introduction (PDF).
¿Tiene preguntas o necesita más detalles?
Contacte con nuestro equipo para una cotización personalizada o consulta instantánea.
Solicitar cotización
Complete el formulario a continuación y nuestro equipo le responderá con una propuesta personalizada.
Chat directo de WhatsApp
¿Prefiere chatear en tiempo real? Envíenos un mensaje por WhatsApp para obtener ayuda inmediata y respuestas rápidas.
- Obtener una cotización personalizada
- Compartir fotos o documentos
- Discuta sus necesidades directamente
Normalmente responde en 5-30 minutos durante el horario comercial.