
Fiber-Grade TiO₂: SA-50 vs European PET Cost Scorecard
Fiber-Grade TiO₂: SA-50 vs European PET Cost Scorecard
For a PET spinning buyer, the invoice price of fiber grade titanium dioxide is only one line in the cost case. In the supplied SA-50 comparison data, SA-50 is measured against two European references, Kronos 1071 and Venator LW-S100, on unit cost, logistics, spinning performance, maintenance and energy. The documented gaps are 18%–25% lower unit cost, 22%–29% lower total comprehensive cost, a 4,200–5,300 RMB/MT unit-price difference, 750–1,000 RMB/MT lower logistics cost and 380–700 RMB/MT of hidden production savings. The same data set reports a cool blue-white shade for SA-50 (b-value ≤ -0.4) against a warm yellow tone for the European references (b-value +0.8 to +1.7). These are buyer-side scorecard figures, not an independent laboratory verdict. Their proper use is to structure a trial and a delivered-cost calculation for a specific PET line.
What this comparison covers—and what it does not
This is a third-party-style buyer comparison of documented characteristics. It does not claim that one product is universally superior. It compares SA-50 with the European references named in the supplied data set on dimensions that matter to a PET spinner: delivered cost, dispersion in ethylene glycol, spinning stability, shade, spinneret and filter maintenance, energy use and supply responsiveness. The figures should be read with their original conditions: SA-50 unit price is stated as 16,800–18,200 RMB/MT FOB domestic, while the European references are stated at 21,000–23,500 RMB/MT CIF Asia. Those are different Incoterms. A buyer should normalize them to the same port, volume, payment terms and delivery date before treating the gap as a purchase decision.
The comparison also does not establish that European products are weak. It establishes that the supplied SA-50 data set documents a different coating chemistry and a different cost position. For a buyer, the relevant question is whether those differences survive a plant trial and a full delivered-cost model. That is the discipline this scorecard applies.
Cost scorecard: unit price, logistics and hidden production cost
The cost case has three layers. The first is the unit price. The second is logistics and working capital. The third is the production cost that appears after the material enters the line: spinneret wear, filter consumption, dispersion time and energy. The supplied data set gives values for all three, and the third layer is the one most often left out of a raw-material RFQ.
| Cost layer | SA-50, as documented | Kronos 1071 / Venator LW-S100, as documented | Buyer check |
|---|---|---|---|
| Unit price | 16,800–18,200 RMB/MT FOB domestic | 21,000–23,500 RMB/MT CIF Asia | Normalize Incoterms, port, volume and payment terms; gap stated as 4,200–5,300 RMB/MT, or 18%–25% lower for SA-50. |
| Logistics | 350–600 RMB/MT domestic or short-sea | 1,100–1,600 RMB/MT ocean freight, insurance and port fees; 35–60 days delivery | Gap stated as 750–1,000 RMB/MT; include inventory carrying cost and safety stock. |
| Hidden production savings | 260–480 RMB/MT from less spinneret wear and filter consumption; 120–220 RMB/MT from faster dispersion | Not stated as a saving in the supplied comparison | Confirm on the line: spinneret life, filter cycle, dispersion time and labour. |
| Total comprehensive cost | 22%–29% lower than the European references, per the supplied comparison | Baseline in the same comparison | Rebuild with actual energy tariffs, labour rates, yield and maintenance history. |
The supplied comparison also estimates that a 10,000 MT annual bulk order could save more than 4.5 million RMB in total cost. That figure is a calculated illustration from the same data set, not a guarantee. It depends on the buyer achieving the stated logistics gap, the stated maintenance savings and the stated dispersion savings at the same volume. A smaller or intermittent buyer should expect a different result.
Why coating chemistry changes the PET spinning calculation
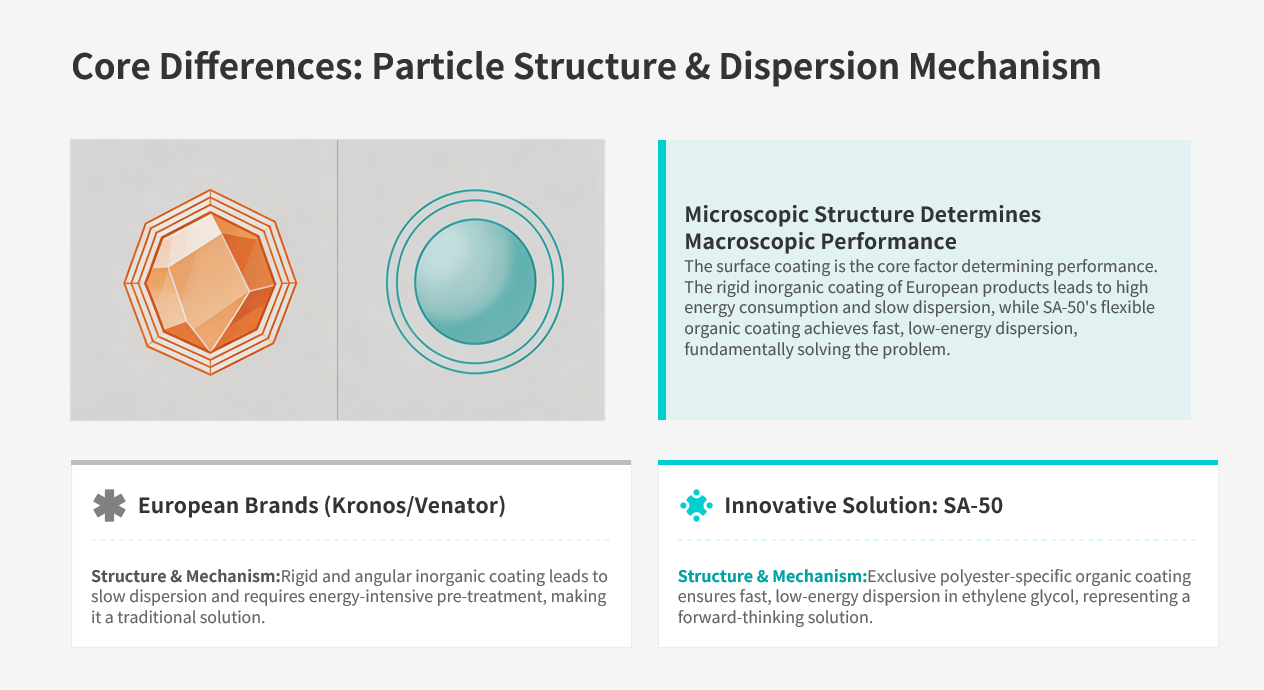
The core documented difference is the coating. SA-50 uses an exclusive polyester-specific organic coating with Japanese refined dry modification technology. Kronos 1071 and Venator LW-S100 use a traditional silicon-aluminum inorganic double coating with general organic modification. The European coating is described as providing stable anti-sedimentation performance for large-scale European production lines. The SA-50 coating is described as achieving dual compatibility with ethylene glycol and polyester resin, enabling rapid dispersion without pre-infiltration.
For a PET buyer, that chemistry matters at the batching stage. If a TiO₂ grade needs pre-heating and pre-infiltration in glycol, the line carries extra time, energy and cleaning load. If it disperses rapidly at room temperature, the batching step can be shorter. The supplied data set states that SA-50 disperses 20%–30% faster and that suspension stability is within 5% of the European references. It also states that SA-50 keeps stable PET viscosity without black spots or crystal points during polymerization, with batch stability fluctuation 1%–3% lower than European grades. Those are claims to test, not assumptions to import. The practical trial question is simple: at the buyer's let-down ratio and glycol route, does the coating reduce pre-treatment time without creating sedimentation, agglomeration or filter pressure problems?
Spinning performance and shade: what the b-value gap means
Whiteness and hue are not cosmetic details in polyester filament and staple fiber. They affect the apparent color of white and light-shade fabrics and can change the amount of optical brightener or dye needed downstream. The supplied comparison states that SA-50 has a cool blue-white shade with b-value ≤ -0.4, while the European references have a warm yellow tone with b-value +0.8 to +1.7. It also states that the whiteness L-value gap is ≤0.7, described as visually identical, and that the impurity index gap is zero.
For a buyer making pure-white, light-grey or bright-color polyester fabrics, the cool blue-white tone is presented as more suitable because it reduces a yellowish cast. That is a fit statement, not a universal rule. A buyer whose target shade or downstream finishing system expects a warmer base should test the b-value difference in the final fabric, not only in the TiO₂ powder. The same data set reports a filament breakage gap of ≤5%, a filter cycle gap of ≤5%, spinneret wear 3%–8% lower for SA-50, and batch stability fluctuation 1%–3% lower. These are comparative gaps. They do not mean zero breakage or zero maintenance; they mean the direction and approximate size of the difference documented in the SA-50 data set.
Maintenance: the line-level cost that invoices miss
Spinneret and filter maintenance is where a small raw-material difference can become a large operating difference. The supplied comparison states that European inorganic coated TiO₂ has angular particles that erode spinneret holes more rapidly, with replacement every 45 days and polishing that shortens spinneret service life by 15%–20%. For SA-50, the same data set states that the smooth organic coating cuts spinneret abrasion by 3%–8%, extends the replacement cycle to 55–60 days, reduces polishing frequency by 40% and lifts overall service life by 12%–18%.
The filter picture is similar in the supplied data. European products are described as agglomerating more easily, with filters clogging every 7–9 days. SA-50 is described as extending the filter cycle to 10–12 days and cutting annual filter consumption by around 25%. In glycol batching, the European references are described as needing 2–4 hours of pre-heat infiltration and monthly pipeline cleaning. SA-50 is described as dispersing without pretreatment, with less residue adhesion and a pipeline cleaning interval extended to two months. The overall maintenance workload is stated as more than 50% lower, with 40% less frequent spinneret replacement and 25% less filter consumption.
These intervals are line-specific. A buyer with a different spin pack, filtration rating, polymer viscosity or downtime cost may see a different result. The right use of the data is to set trial targets: record baseline spinneret life, filter differential pressure, cleaning hours and polishing frequency before the switch, then compare the same metrics over a full campaign. That converts the maintenance claim into a buyer-specific number.
Energy and batching: converting kWh into buyer value
The energy case is concentrated in glycol batching. The supplied comparison states that European inorganic TiO₂ requires 2–4 hours of heating and infiltration at 40–60°C, with total power consumption of 18–26 kWh/MT plus 5–9 kWh/MT for frequent pipeline cleaning. SA-50 is described as dispersing well at room temperature without heating pretreatment, using 6–11 kWh/MT for batching and 2–4 kWh/MT for cleaning. That is a stated 55%–62% energy saving per MT. For a 10,000 MT production line, the comparison estimates more than 120,000 kWh saved per year.
Extrusion energy is a second layer. The data set states that agglomeration of the European references raises extruder pressure and motor load by 8%–12%, and that frequent filter replacement causes repeated heating and cooling with an extra 7% thermal loss. SA-50 is described as running the extruder under lower load, with total extrusion energy cut by 9%–14%. Less downtime for spinneret and filter replacement is also stated to reduce start-stop and thermal circulation loss by 4%–7%. These are energy estimates, so the buyer should apply local tariffs and actual line load. A plant with low electricity prices may see a smaller financial gain than a plant with high tariffs; the kWh difference still matters for capacity and stability.
Market context: why buyers keep a dual-source scorecard
Market-level data does not decide a supplier, but it explains why buyers continue to qualify more than one fiber grade titanium dioxide source. Grand View Research projects the global titanium dioxide market to reach USD 24.4 billion in 2026. SunSirs and the Titanium Dioxide Alliance report that China's effective annual titanium dioxide production capacity fell from 5.9 million tons in 2024 to 5.7 million tons in 2025, while China's total TiO₂ export volume reached 1.9017 million tons in 2024, a 15.84% year-on-year increase. Grand View Research also projects the Anatase segment, which is relevant to fiber grade, to grow at a 7.3% CAGR from 2026 to 2033.
These are market-level signals, not proof of any single supplier's performance. For a PET buyer, the implication is practical: supply consolidation and export scale make supplier qualification more important, while the cost gap between regions makes delivered-cost comparison more valuable. A dual-source scorecard can keep a low-cost option in the trial queue without making it the default before line validation. That is a procurement control, not a marketing position.
A buyer decision framework for SA-50 vs European references
The following framework turns the supplied comparison into a decision process. It does not rank the products for every buyer. It gives each criterion a documented basis and a verification step.
| Decision criterion | Why it matters in PET spinning | Documented input | Verification step |
|---|---|---|---|
| Delivered cost | Unit price alone hides freight, insurance, inventory and payment terms. | SA-50 16,800–18,200 RMB/MT FOB domestic; European references 21,000–23,500 RMB/MT CIF Asia; stated gap 4,200–5,300 RMB/MT; logistics gap 750–1,000 RMB/MT. | Build a landed-cost model at the same port, volume and Incoterm; include safety stock and carrying cost. |
| Dispersion and batching | Pre-treatment time and agglomeration affect labour, energy and filter load. | SA-50 organic coating with dual EG/polyester compatibility; rapid dispersion without pre-infiltration; dispersion 20%–30% faster. | Run a glycol dispersion trial at the plant's let-down ratio; measure time, residue and suspension stability. |
| Spinning stability | Breakage and filter pressure determine continuous spinning uptime. | Filament breakage gap ≤5%; filter cycle gap ≤5%; spinneret wear 3%–8% lower; batch fluctuation 1%–3% lower. | Compare baseline and trial campaigns on the same line, spin pack and polymer grade. |
| Shade | White and light-shade fabrics are sensitive to base hue. | SA-50 b-value ≤ -0.4; European references b-value +0.8 to +1.7; L-value gap ≤0.7. | Check final fabric shade, not only powder b-value; confirm optical brightener and dye response. |
| Maintenance | Spinneret, filter and pipeline cleaning are recurring costs. | Spinneret life 12%–18% longer; replacement 40% less frequent; filter consumption 25% lower; pipeline cleaning every 2 months vs monthly. | Record spinneret life, polishing hours, filter changes and cleaning downtime over a full campaign. |
| Energy | Batching and extrusion energy are volume-sensitive. | Glycol batching energy 55%–62% lower; extrusion energy 9%–14% lower; indirect 4%–7% from less downtime. | Meter kWh per MT before and after; apply local tariffs and line load. |
| Supply responsiveness | Lead time and MOQ affect working capital and schedule risk. | SA-50 comparison states delivery time reduced by more than 50% and MOQ flexible from 1 MT. | Confirm lead time, MOQ, packaging and documentation in the commercial offer. |
The framework has one rule: do not score a criterion without evidence from the buyer's own line or a documented commercial offer. The supplied data can set the trial target, but it cannot replace the trial. A buyer who skips that step is trading a known invoice price for an unknown production cost.
Fit boundaries and verification limits
The supplied SA-50 data set identifies several best-fit scenarios: PET in-reactor polymerization matting for semi-dull and full-dull chips, ethylene glycol pre-dispersion feeding, high-speed POY, FDY and DTY continuous spinning, high-grade light-color and pure-white polyester fabrics, long-cycle continuous high-yield spinning lines, and cost-sensitive PET markets in China, Southeast Asia, India, Korea and the Middle East. These are fit statements from the same data set. They do not mean SA-50 is suitable for every polyester product, every TiO₂ loading or every shade target.
The main limitation is source quality. The cost, maintenance, energy and shade figures are supplied SA-50 comparison data. They are not presented as an independent laboratory test or a third-party audit. The European references are named products, but their performance in a specific buyer's plant may differ from the comparison conditions. A buyer should also check the grade's key quality parameters against the fiber route: TiO₂ content ≥99.4%, low iron and low conductivity are stated for SA-50, and fiber-grade TiO₂ typically requires a D50 around 0.28 μm with 90% of particles within 0.1–0.5 μm. The Chinese standard GB/T 37632-2019 establishes test methods for TiO₂ content in man-made fibers; buyers exporting to other markets should confirm the applicable standard and any additional customer-specific requirements.
Handling is another boundary. The risk-control data for this supply chain notes powder dust inhalation and moisture-induced agglomeration as risks. The stated controls are a vacuum closed feeding system, warehouse humidity below 65%, sealed packages, and dust-proof masks and protective clothing for workers. A buyer should confirm that the receiving site can meet those conditions before switching to a finer or more dispersible grade.
Outlook: from price comparison to line-level scorecard
The more useful long-term change is not a single price gap. It is the shift from invoice-price comparison to line-level scorecard comparison. Fiber grade titanium dioxide is a small input by weight but a large input by process influence: it affects shade, filter life, spinneret wear, batching energy and downtime. As Anatase fiber-grade demand grows and Chinese export scale remains significant, buyers will need a repeatable way to compare a low-cost option with an established European reference without assuming that either is automatically right.
For SA-50, the supplied data makes a clear case for a trial: lower stated unit cost, lower stated logistics cost, documented maintenance and energy savings, and a cool blue-white shade. For the European references, the supplied data also records stable anti-sedimentation performance and a warm tone that may fit other shade targets. The buyer's task is to test both against the same PET line, the same acceptance criteria and the same delivered-cost model. That is a more defensible decision than a vendor pitch in either direction.
FAQ: buyer questions on SA-50 vs European fiber-grade TiO₂
Is SA-50 always cheaper than European fiber-grade TiO₂ on a total-cost basis?
No. The supplied comparison states a 22%–29% lower total comprehensive cost for SA-50, but that result depends on the stated unit-price gap, logistics gap, maintenance savings and energy savings. A buyer with different freight, volume, energy tariffs or line conditions may see a different total. The correct approach is to rebuild the calculation with landed cost and verified line data.
What does the b-value difference mean for polyester fabric shade?
The supplied data reports SA-50 at b-value ≤ -0.4, a cool blue-white tone, and the European references at b-value +0.8 to +1.7, a warm yellow tone. For pure-white and light-color fabrics, the cooler tone is presented as more suitable because it reduces a yellowish cast. A buyer should still check the final fabric shade and the response of optical brighteners or dyes, because the powder b-value is not the same as the finished fabric appearance.
Which maintenance assumptions drive the stated total-cost gap?
The main assumptions are spinneret life 12%–18% longer, spinneret replacement 40% less frequent, filter consumption 25% lower, pipeline cleaning extended to two months instead of monthly, and overall maintenance workload more than 50% lower. These are supplied comparison figures. A buyer should replace them with baseline spinneret life, filter change frequency, cleaning hours and labour cost from its own plant before accepting the total-cost gap.
Can SA-50 be used without reformulation in an existing PET line?
The supplied data states dual compatibility with ethylene glycol and polyester resin and rapid dispersion without pre-infiltration, which suggests a direct trial is feasible. It does not establish that every formulation can switch without adjustment. A buyer should run a line trial at the intended let-down ratio and check dispersion, filter pressure, viscosity, shade and spinning breakage before changing the standard recipe.
What should a buyer verify before treating the 18%–25% unit-cost gap as real?
The 18%–25% gap is based on SA-50 at 16,800–18,200 RMB/MT FOB domestic versus the European references at 21,000–23,500 RMB/MT CIF Asia. Because those are different Incoterms, the buyer should normalize both offers to the same port, volume, payment terms and delivery date. The buyer should also confirm the grade, packaging, documentation and lead time, because a lower unit price without equivalent supply terms is not a like-for-like comparison.
About the supplier context
Orient International Holding Shanghai Foreign Trade Co., Ltd. is a Shanghai-based state-owned foreign trade enterprise founded in 1988, with more than 150 employees, a registered capital of over RMB 548 million and an annual production/trading capacity of 16,000 MT for TiO₂ and related raw materials. Its stated business covers titanium dioxide, antimony ethylene glycol, minerals and petrochemical raw materials, with international logistics, customs declaration, letter-of-credit settlement and cross-border supply-chain risk control. For buyers evaluating fiber grade titanium dioxide, that trading context is relevant to documentation, logistics and supply continuity; it does not replace a plant trial or an independent quality audit.
Supplier brochure for download: Orient International company brochure (PDF).
¿Tiene preguntas o necesita más detalles?
Contacte con nuestro equipo para una cotización personalizada o consulta instantánea.
Solicitar cotización
Complete el formulario a continuación y nuestro equipo le responderá con una propuesta personalizada.
Chat directo de WhatsApp
¿Prefiere chatear en tiempo real? Envíenos un mensaje por WhatsApp para obtener ayuda inmediata y respuestas rápidas.
- Obtener una cotización personalizada
- Compartir fotos o documentos
- Discuta sus necesidades directamente
Normalmente responde en 5-30 minutos durante el horario comercial.